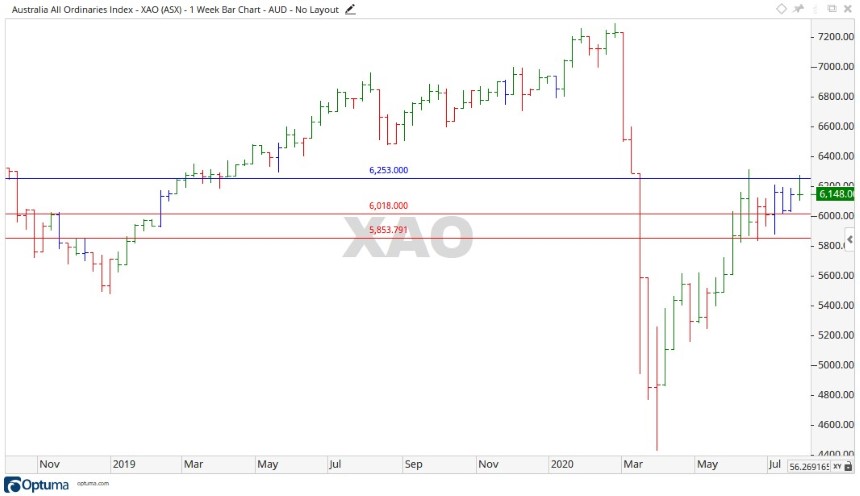
In the week been the All Ordinaries [XAO] continued its movement sideways. In a worrying sign the overall range for the week of trading was 171 points, but with the open Monday being 6,144 points and the close Friday being recorded at 6,148 points, the net movement is only four points for the week.
This represents indecision in the market as neither buyer nor seller is controlling the direction.
Source: Optuma
ASX outlook for the week ahead
The week coming may well be very telling for the future direction. The price is still unable to crack the level of 6,253 points, a level that over the past seven weeks proved to be a short-term ceiling to a move higher.
For the market to be considered bullish, the price would need to move above this level and close above it.
As outlined in last week’s ASX Outlook, the current move up may well be a ‘wave B’, if this is the case its exhaustion could be close. The downside move could push through the levels of 6,018 and 5,853 points quickly, in the event of a fall.
A closer look at the ASX
The week been was another of very small movements for most stocks. Not too many in the top 200 are taking a direction at this stage.
Glancing at the sectors, both Financials and Materials closed back on their open, making for a flat week. Consumer Discretionary pushed 1.17% to the upside. Communication Services retraced 2.29%.
Looking into the stocks, Galaxy Resources Ltd [ASX:GXY] jumped up 27.90%, also QBE Insurance Group Ltd [ASX:QBE] and Orocobre Ltd [ASX:ORE] both held strong gains of 10.99% and 13.21%, respectively.
On the downside, Alumina Ltd [ASX:AWC] fell back 7.22%, also Brambles Ltd [ASX:BXB] and BHP Group Ltd [ASX:BHP] lost 5.49% and 2.78%, respectively.
A broader outlook for the ASX
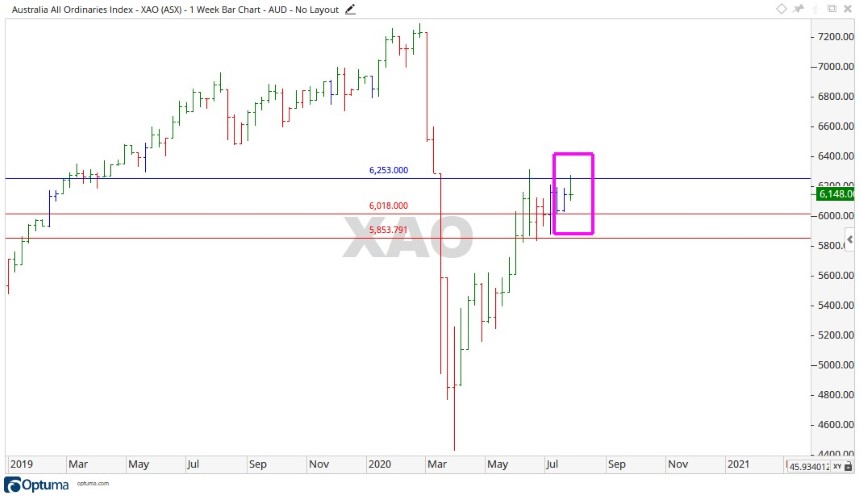
Following on from last week’s outlook of where the XAO may be in its Elliott wave sequence, this week been presented an interesting sign.
Source: Optuma
The most recent bar on the chart is an important bar in technical analysis terms and is what is known as a ‘Doji’.
This name comes from the Japanese candlestick charting technique, thought to be developed in the 18th century.
What this bar represents is indecision in the market or in Japanese terms, blunder or mistake.
Where the All Ords currently sits, this may prove to be a powerful signal in terms of the wave sequence.
- Price has flattened out over the last seven weeks
- Failure to push through 6,253 points
- The Elliott wave sequence lining up
- The appearance of a Doji — or sign of indecision
The economic situation of the country and the world in general is still looking very fragile, this might just be the turning point in the market where stock prices begin to reflect the decline in business conditions.
Regards,
Carl Wittkopp,
For Money Morning
PS: Four Well-Positioned Small-Cap Stocks: These innovative Aussie companies are well placed to capitalise on post-lockdown megatrends. Click here to learn more.


Comments