• Skip to primary navigation
  • Skip to main content
  • Skip to primary sidebar
  • Skip to footer

Fat Tail Daily

Investment Ideas From the Edge of the Bell Curve

  • Menu
    • Commodities
      • Resources and Mining
      • Copper
      • Gold
      • Iron Ore
      • Lithium
      • Silver
      • Graphite
      • Rare Earths
    • Technology
      • AI
      • Bitcoin
      • Cryptocurrency
      • Energy
      • Financial Technology
      • Bio Technology
    • Market Analysis
      • Latest ASX News
      • Dividend Shares
      • ETFs
      • Stocks and Bonds
    • Macro
      • Australian Economy
      • Central Banks
      • World Markets
    • Small Caps
    • More
      • Investment Guides
      • Premium Research
      • Editors
      • About
      • Contact Us
  • Latest
  • Fat Tail Series
  • About Us
Macro Central Banks

Suncorp Share Price Reflects Death of Banks, Not Disasters (ASX: SUN)

Like 0

By Lachlann Tierney, Tuesday, 11 February 2020

At time of writing, the share price of Suncorp Group Ltd [ASX:SUN] is down 3.28%, trading at $12.10. The Suncorp share price reflects the death of banking, not the immediate pain caused by disasters to the company’s bottom line...

At time of writing, the share price of Suncorp Group Ltd [ASX:SUN] is down 3.28%, trading at $12.10.

You can see the chart going back to 2013 below:

ASX SUN - Suncorp Share Price Chart - Bank Stocks

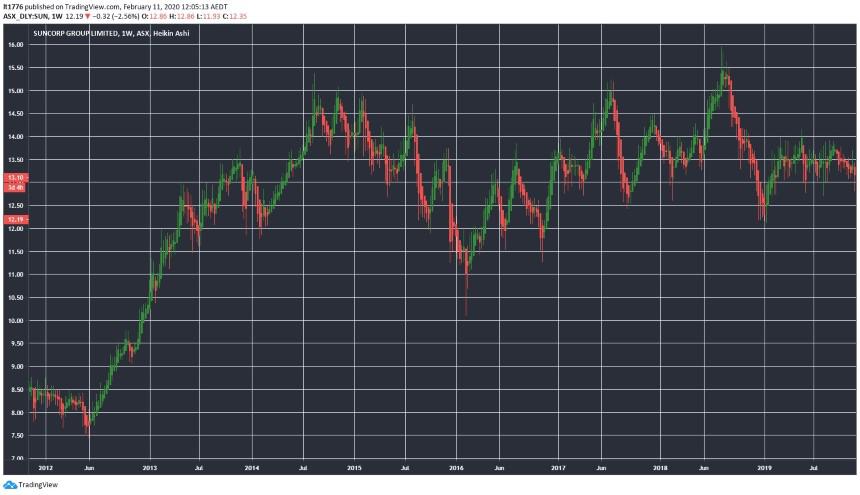
Source: tradingview.com

Today the main idea is that the Suncorp share price reflects the death of banks, not the immediate pain caused by disasters to the company’s bottom line.

Suncorp maintained its dividend this time around, find out why this could be increasingly difficult going forward.

Key points from Suncorp’s results release, impact of disasters hurts share price

Here are the key points from the Suncorp results release:

  • NPAT up 156.8% to $642 million
  • Net profit from continuing operations down 6.2% to $396 million
  • Revenue down 6% to $7.05 billion
  • Interim dividend of 26 cents

The results come after the company, which does insurance as well, faced more than 42,000 claims in Australia and more than 3,000 in New Zealand.

This came from seven natural hazard events over the half year.

And when you take out the sales of two repairs businesses, Capital SMART and ACM Parts, things look worse.

Its dividend payout of 26 cents is quite generous though, especially considering the payout ratio is 89.5% of cash earnings.

That means though, that there isn’t much in the way of funds available to grow Suncorp as a business, despite how much long-term shareholders may like it now.

Chart shows that Suncorp’s share price moved sideways for seven years

The chart at the start says it all.

The Suncorp share price is now sitting at around the same level as it was in 2013.

Seven years is a long time in the investment world and it is an indicator that Suncorp as a whole is maintaining its business, but not growing it.

Over the last three years it has had a dividend yield of around 5%.

So it seems that for years many investors were happy to scrape 5% away, minus inflation of 2%, and walk away with 3% in real profits from a perceived safe investment.

But here is the interesting bit.

I think Suncorp’s payout ratio may not be sustainable as fintech moves in on its core business.

Innovation and/or acquisitions take time and capital, something which Suncorp may not have over the next three to five years.

As a result, the impact of disasters is certainly a factor in today’s Suncorp share price — but the slow asphyxiation of traditional banks is the long-term story.

You can read more about why bank dividends could be cut here.

You can also find out about three fintech stocks chipping away at the banks’ core business here.

Regards,

Lachlann Tierney,
For Money Morning

All advice is general advice and has not taken into account your personal circumstances.

Please seek independent financial advice regarding your own situation, or if in doubt about the suitability of an investment.

Comments

Subscribe
Notify of
guest
guest
0 Comments
Inline Feedbacks
View all comments
Lachlann Tierney

Lachlann’s Premium Subscriptions

Publication logo
Fat Tail Investment Research

Latest Articles

  • America on a War Footing: Implications as US Mineral Strategy Turns to Africa
    By James Cooper

    Geologist James Cooper examines the potential implications of America’s heavy focus on West Africa. Why is the US becoming deeply involved here? And what could the consequences be?

  • The biggest quarter on record for this share
    By Callum Newman

    We can see why the stock market didn’t react much to the RBA holding rates steady last meeting. Everyone expects rates to go down. It’s just a question of when. Fixed rate loans, and refinancings, are withering away as the market positions for more rate cuts. This is what you and I want to see as investors…

  • The US$2 Trillion Stablecoin Tsunami
    By Charlie Ormond

    These developments could transform the US$250 billion stablecoin market into a US$2 trillion juggernaut within years.

Primary Sidebar

Latest Articles

  • America on a War Footing: Implications as US Mineral Strategy Turns to Africa
  • The biggest quarter on record for this share
  • The US$2 Trillion Stablecoin Tsunami
  • Trump Sparks Rare Earth Rally
  • Copper Breaks Out: Are You Positioned?

Footer

Fat Tail Daily Logo
YouTube
Facebook
x (formally twitter)
LinkedIn

About

Investment ideas from the edge of the bell curve.

Go beyond conventional investing strategies with unique ideas and actionable opportunities. Our expert editors deliver conviction-led insights to guide your financial journey.

Quick Links

Subscribe

About

FAQ

Terms and Conditions

Financial Services Guide

Privacy Policy

Get in Touch

Contact Us

Email: support@fattail.com.au

Phone: 1300 667 481

All advice is general in nature and has not taken into account your personal circumstances. Please seek independent financial advice regarding your own situation, or if in doubt about the suitability of an investment.

The value of any investment and the income derived from it can go down as well as up. Never invest more than you can afford to lose and keep in mind the ultimate risk is that you can lose whatever you’ve invested. While useful for detecting patterns, the past is not a guide to future performance. Some figures contained in our reports are forecasts and may not be a reliable indicator of future results. Any actual or potential gains in these reports may not include taxes, brokerage commissions, or associated fees.

Fat Tail Logo

Fat Tail Daily is brought to you by the team at Fat Tail Investment Research

Copyright © 2025 Fat Tail Daily | ACN: 117 765 009 / ABN: 33 117 765 009 / ASFL: 323 988