Is this already priced in?
A story may be interesting, a story may be trending, but the right question to ask is whether the story’s implications are already reflected in the price. Has the market already incorporated the story?
AI is taking over the world? Interesting story, but move on…it’s already priced in.
Nvidia the new hottest stock on the block? Forget about it, the ship’s already sailed.
It is this question – what is and what isn’t priced in – that drives Fat Tail’s latest investment podcast.
This week, Greg and I discussed the bond market’s recessionary bets, slumping commodity prices, whether the markets are wrong about China, and whether coal stocks offer great value … or great risk.
Listen on Spotify:
Stories of the week
The biggest story to catch Greg’s eye this week was the perennial pair – inflation and interest rates.
Australian headline inflation picked up in April, leading to a big fall in the Aussie market on Wednesday.
The headline inflation figure of 6.8% in the 12 months to April came in hotter than many boffins expected, and was up from 6.3% recorded in March.
Consensus estimates predicted inflation hitting about 6.4%.
A material miss.
On a positive note, excluding volatile items, the annual movement of the April CPI indicator was 6.5%, actually lower than the 6.9% recorded in March.
But trimmed mean inflation rose from 6.5% (recorded in both February and March) to 6.7% in April.
Greg thinks this means the Reserve Bank will keep monetary policy tighter for longer.
Another story that caught our eye was the narrowness of the US tech rally.
Here it helps to enlist the help of Wall Street titan Bob Farrell.
Farrell started out as a tyro learning from value investing fathers Ben Graham and David Dodd.
After decades on Wall Street, Farrell distilled his experience into 10 investment rules.
The seventh rule concerns us here:
Markets are strongest when they are broad and weakest when they narrow to a handful of blue-chip names.
Ring any bells?
The S&P 500, which is up about 10% in 2023, would be down for the year without the help of only eight stocks – the mega-cap tech giants pulling the index higher along with them.
According to Farrell, the US market is weak.
But is this a bad omen?
Should a savvy stock picker care?
Greg had some great answers to this question.
From my end, the narrowness of the tech rally reminded me of an oft-cited study by finance professor Hendrik Bessembinder.
Studying stock returns in US public markets from 1926 to 2016, Bessembinder found:
‘While the overall US stock market has handily outperformed Treasury bills in the long run, most individual common stocks have not. Of the nearly 26,000 common stocks that have appeared on CRSP from 1926 to 2016, less than half generated a positive lifetime buy-and-hold return (inclusive of reinvested dividends) and only 42.6% have a lifetime buy-and-hold return greater than the one-month Treasury bill over the same time interval. The positive performance of the overall market is attributable to large returns generated by relatively few stocks.’
These ‘relatively few stocks’ are the likes of Apple, Amazon, Microsoft, Meta, and Alphabet.
Stocks of the week
The stocks under the spotlight this week were ASX coal stocks. And boy, have they taken a beating lately as the price of coal tumbled.
The selling pressure, however, has led to some interesting valuations.
Whitehaven Coal [ASX:WHC] is down ~35% year to date, trading on a trailing dividend yield of about 12% and trailing PE of 1.6!
New Hope [ASX:NHC] is down ~20% YTD on a trailing dividend yield of about 13% and a trailing PE of 3.4!
And Yancoal [ASX:YAL] is a doozy. The stock is down over 20% YTD but trades on a trailing dividend yield of 27% and a trailing PE of 1.7!!
That said, Yancoal’s free float is under 20% and has attracted little analyst attention, skewing the metrics.
What can we make of these numbers?
They may look enticing, but one has to tread carefully. As Peter Lynch once warned:
‘Buying a cyclical (e.g. commodities) after several years of record earnings & when the P/E ratio has hit a low point is a proven method for losing half of your money in a short period of time.’
Although Greg thinks it’s foolish to go against someone like Lynch, he did offer a contrarian idea on coal stocks centred around structural demand for coal amid an unrealistically rapid energy transition.
Greg also spotlighted the Bank of Queensland, which hit a new 52-week low this week after AUSTRAC and APRA criticised the bank’s board for risk management failings.
Years ago, Michael Burry – of The Big Short fame – wrote that his strategy was to ‘buy shares of unpopular companies when they look like road kill and sell them when they’ve been polished up a bit’.
Is Bank of Queensland just this kind of road kill?
Watch to find out Greg’s answer – and his valuation process.
What’s not priced in
As for what the market is not pricing in, Greg covered three things.
- China and the outlook for commodities: what’s not priced in here is things being not as bad as expected in China over the short-term. As for the long-term outlook on commodities, the structural imbalance between supply and demand suggests things are bullish for copper, oil, and coal.
- Debt ceiling resolution will likely result in short-term liquidity withdrawal due to the US Treasury General Account being filled back up. The Treasury will soon have to replenish its dwindling cash balance by selling potentially over US$1 trillion of bills through the end of the third quarter. That could suck a huge amount of liquidity out of markets.
- Corporate earnings: S&P 500 consensus earnings show earnings growth bottoming in the current quarter, then growing 5.8% in Q3 over Q2, then 3.1% in Q4 over Q3. And 2024 EPS growth of 11.4%. But has the market accurately reckoned with what a recession will do to earnings? The S&P500 currently trades on forward P/E of 18.2, which is an earnings yield of about 5.6%. The 10-year bond yield is around 3.7%. That’s a tiny equity risk premium.
Charts of the week
We ended the episode with some charts which Greg found most illuminating.
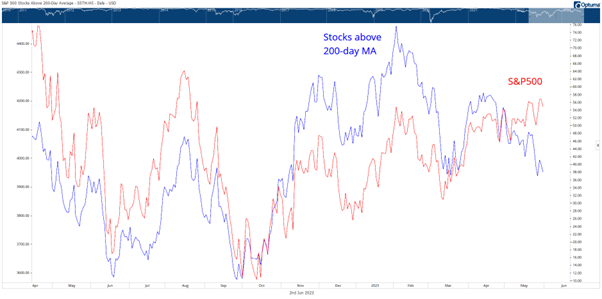
Like this one, for instance, showing the disparity between the recent tech rally and the performance of the broader market:
 Source: Optuma
As you can see, the S&P 500 correlated strongly with the number of stocks above their 200-day moving average.
But this correlation broke down in recent weeks.
Despite the number of stocks trading above their 200-day moving average falling sharply over the past two months, the S&P 500 pushed higher.
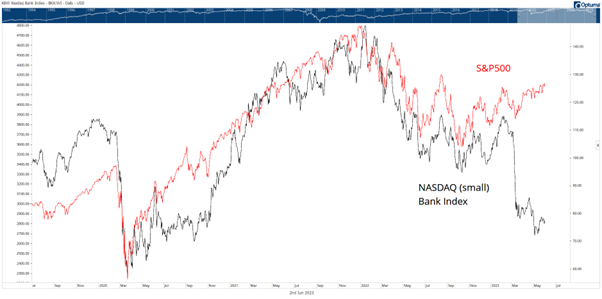
And here’s another great chart.
 Source: Optuma
It shows the diverging performance of the S&P 500 against the KBW NASDAQ Bank index [BKX] – a proxy of the financial health of the wider market.
That’s quite the uncoupling!
Regards,
Kiryll Prakapenka

