Whether it be on a conscious or subconscious level, every single one of us is making a prediction about the future.
From experience, my observation is that most people rely on ‘what has been, will continue to be so’ to factor heavily in their predictive reasoning.
Whether the ‘what has been’ is good or bad, it’s expected the future will consist of more of the same.
Will the prediction be right or wrong?
That depends on your time frame.
Short term, the prediction could be right…the good or bad times might continue.
Medium term, it can be a coin toss…conditions may or may not last longer than the average.
Longer term, the present day ‘what has been’ fades away and is always replaced by a new and altered set of conditions.
What was once good turns to not-so-good or goes really bad, and vice versa.
The nearer the future we’re trying to predict — like, what will the market or cryptos do next week or next month — the tougher the exercise.
In the investing business, as in life, we have to accept not all our choices, guesstimates, and/or reasoned decisions are going to be correct…that whole ‘best laid schemes o’ mice an’ men’ thing.
There are times when we’re going to be right on the money and others when we’re dead wrong.
The secret to managing the risk associated with wealth creation AND retention is ‘how much you make when you are right, and how much you lose when you are wrong’.
Finding the appropriate balance of risk versus reward for your personal situation and tolerance for pricing volatility can be a moving target.
I know from my years in the personal advice business that when markets are good, people tend to overestimate their capacity to handle risk.
Conversely, amid a brutal bear market, risk profiles tend to shift to the more conservative end of the scale.
The ‘what has been, will continue to be so’ syndrome massively influences our predictive senses.
Trying to stay grounded and making asset allocation choices appropriate for your personal situation and market conditions is a constant and evolving quest.
The Gowdie Letter and The Gowdie Advisory are very personal projects for me. These are like my weekly ‘dear diary’ entries.
Putting thoughts on paper is a cathartic exercise, so the journals are written as much for me as they are for you.
Behind each ‘diary entry’ there’s a myriad of thoughts, questions, doubts, and assumptions. Just to name a few:
- What’s confirming or challenging my predictions of the future?
- Should we be looking at alternatives or stay the course?
- Do I look at buying or selling our short positions/precious metals/REITs/commodities/ASX 200 or retain an overweight cash position?
- Are there any low-risk/high-reward opportunities out there to consider OR high-risk/low-reward options to avoid?
Due to where I’m at in my life cycle, predictions about the future are seen through the prism of ‘avoiding the BIG LOSS’ (a life-changing level of capital destruction).
In my youth, the prism bore a different label…it was ‘making the BIG GAIN’.
That’s no longer my objective.
Therefore, my decisions are based primarily on ‘what can go wrong’ and, if it does go wrong, is there an acceptable level of downside? One that avoids the BIG LOSS?
History and experience suggest there’s NEVER been a more critical time to be concerned by the prospect of a BIG LOSS.
However, due to complacency, belief in the Fed, and industry assurances, a collective undisturbed subconscious has (in my opinion) many people sleepwalking towards a cliff.
Gauging the recent action on Wall Street, confidence in the resumption of ‘normal’ market conditions remains elevated. Having ‘seen this movie before’, my view is that this confidence is not warranted.
I’m going to share with you some observations and predictions based on ‘what has been, is not what’s going to be’.
Recentism — the selling of past performance
In late 2006, I was invited to attend a private boardroom meeting with a high-profile CEO of a well-known institutional funds management firm.
At the time, the institutional manager was running an ad campaign that just so happened to highlight the solid performance of its flagship funds.
For a little context, the US housing bubble was within 12 months of busting.
I suggested to the CEO, ‘this form of advertising was a little misleading…after all, past performance is no guide to future returns’.
The CEO’s almost clinical response was, ‘that’s true, but past performance sells’.
End of conversation.
Industry super funds — compare the pair — adopt the same past performance marketing approach.
The industry’s subtle and not-so-subtle messaging on performance is designed to influence investor predictions about the future.
A superannuation member who remains invested in a balanced or growth fund that has performed reasonably well is expecting (whether they realise it or not) the future to rhyme (more or less) with the past.
But, if our future is ‘going to hell in a handbasket’, then making the wrong prediction with the entirety of your retirement capital could seriously derail those ‘well-laid’ plans.
In the event members are subjected to a sustained period of negative performance, you’d expect a good percentage of investors in balanced or growth funds to experience an awakened consciousness…predicting ‘more of the same pain’ awaits and consciously switching to portfolios heavily weighted in cash.
In the short term, this switch could be the right move. However, in the longer term, it’s likely to cost them dearly…as they missed participating in the inevitable recovery.
The term ‘recentism’ is defined as recent experience — be it good or bad — influencing future choices and/or predictions.
Positive recentism is why ad agencies, fund managers, and industry funds dedicate considerable resources to promoting (what is essentially) past performance.
While watching the World Cup, memories of that 2006 boardroom meeting came flooding back last week.
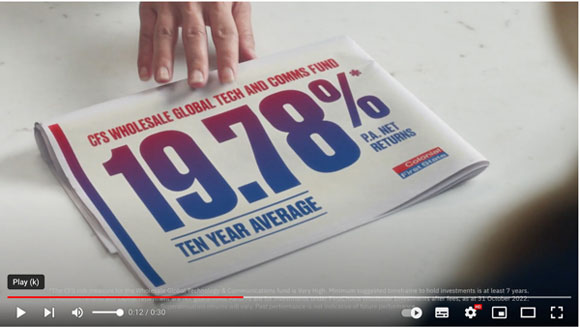
Colonial First State (CFS) recently launched a four-part ad campaign.
One of the ads is for the CFS Wholesale Global Tech & Comms (Communications) Fund.
Here’s a screenshot from the ad.
19.78% P/A NET RETURNS — 10-YEAR AVERAGE…looks good, doesn’t it?
|
|
| Source: YouTube |
Do you think the Global Tech & Comms Fund’s past performance offers more appeal compared to, let’s say, the CFS FirstChoice Wholesale Defensive Fund?
|
|
| Source: CFS |
If you were responsible for running an ad campaign, which fund would you choose to promote?
The Tech & Comms fund is a no-brainer.
Why?
For all the disclaimers on ‘past performance is NOT a guide to future performance’, the recentism reality is that past performance sells.
Solid double-digit numbers for a decade make predicting the future easy…more of the same awaits.
But does it?
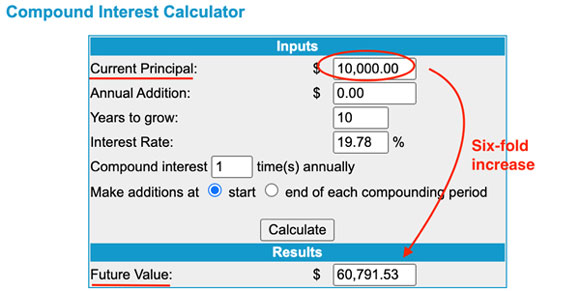
Here’s the compound return calculation on $10,000 over 10 years at 19.78% per annum — a six-fold increase in capital value.
A truly excellent result…on the small, but not insignificant, proviso you were invested in the fund.
|
|
| Source: MoneyChimp |
But how was this level of return possible?
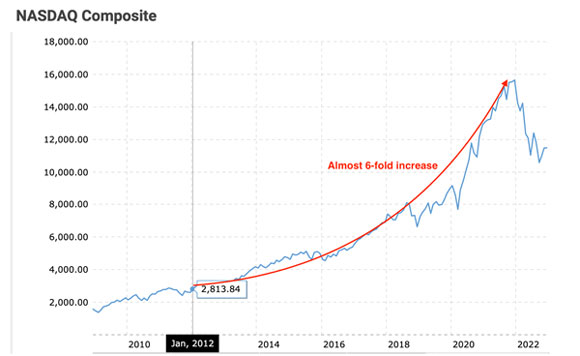
The product title — Global Tech & Comms Fund — gives us the crumbs we need to trace the performance history back to the source.
Guess what the Nasdaq Index has returned over the same period. Isn’t that a surprise?
|
|
| Source: Macrotrends |
Of all the major global indices, the Nasdaq was (by far) the best performer during the inflating of the most speculative asset bubble in HISTORY.
Therefore, it stands to reason a fund (which, more or less) mirrored the Nasdaq performance would rack up an impressive decade-long compound rate of return.
But that was then.
Is it likely ‘what has been’ is going to become ‘what will be’?
That’s the prediction anyone who’s been swayed by the power of the advertising message has to make.
Before falling into the past performance trap, they should consider…
Will Apple fall from the Nasdaq tree?
Apple — a global tech and communications giant — represents almost 13% of the Nasdaq Index.
Year-to-date, Apple’s share price has resisted the worst of Wall Street’s bearish actions. But is that resistance about to crack?
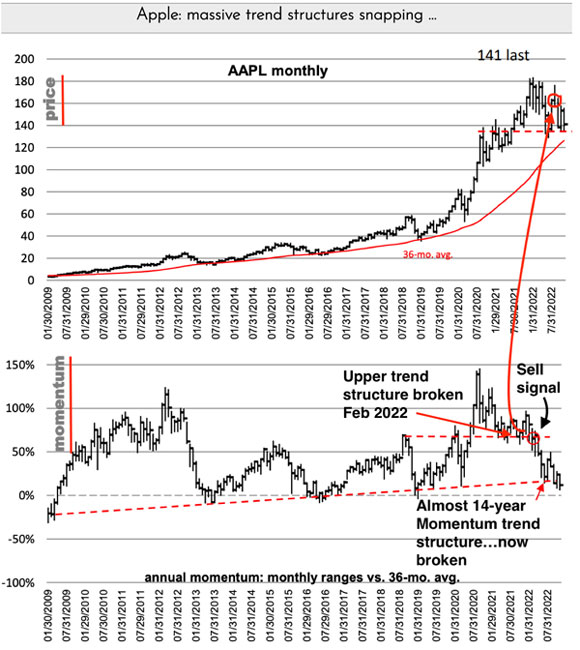
Momentum Structural Analysis (MSA) produced a recent update on the momentum trend in the Apple share price.
The title says it all: ‘Apple: massive trend structures snapping…’
The bottom chart (labelled Momentum) is the one to focus on.
When the upper trend structure (dashed red line) was broken in February 2022, MSA issued a SELL signal on Apple. The price was US$165.
Since then, the share price has fallen as low as US$130 and is currently around US$148:
|
|
| Source: MSA |
While the share price has bounced around, momentum has been steadily falling back towards the longer-term (almost 14 years) downside structural support line.
Recently, momentum went through this support level.
Here’s an edited version of the MSA commentary that accompanied the chart (emphasis added):
‘Of the big three — Amazon, Apple, and Microsoft — AAPL [Apple] is the one that has declined the least since MSA first declared a top (in February 2022 for AAPL with price above $165).
‘But frankly it’s not looking good for this holdout symbol. Not good at all.
‘AAPL’s momentum closed below that structure in September, up-ticked in October, and is now below the major line again…And once again credibly below the massive dozen year-old trend structure. It’s rare indeed to see such a clear and massive structure developed by momentum.
‘We think it means a lot. Very negative.’
If Apple’s pricing resistance gives way to the momentum of selling persistence (Phase 2 of the Bear Market), we should expect the Nasdaq Index to be hit hard…taking funds like ‘Global Tech & Comms’ with it.
In this scenario, the prospect of ever receiving 19.78% per annum in the short or medium term is highly unlikely.
But this is what happens at the tail end of bull markets.
Managers with good performance figures tell their tales. They know how powerful the ‘what has been’ syndrome is when it comes to investment selection choices.
Making predictions about the future is a little easier when you have some experience, an appreciation of history, and access to quality research. But that doesn’t mean the Apple share price is going to fall tomorrow or next week…but what about in 2023?
If, as is likely, Apple does fall from the Nasdaq tree, then so goes the Dow and S&P 500 Index…
|
|
| Source: Slick Charts |
|
|
| Source: Slick Charts |
Regards,
 |
Vern Gowdie,
Editor, The Daily Reckoning Australia


