

As you might recall, we examined the copper market in depth earlier in the year, detailing its massive divergence from the market, rising almost 30% for the first three months of 2025.
As I explained, rising imports into the US (ahead of tariffs) were pushing up the price of copper on the benchmark COMEX exchange to new all-time highs.
So we asked… Would copper’s momentum continue after the ‘tariff effect’ began to unwind?
Copper futures were pressing new all-time highs…
A historic break-out looked imminent.
But then Friday, April 4, 2025, rolled around. Trump’s infamous tariff announcements sent stock markets across the globe tumbling.
Incredibly, copper futures fell a historic 9% in just one session.
That was a blow for anyone anticipating a strong imminent move in the commodity sector.
In the first week of last month, copper returned the bulk of its gains from 2025.
But with the dust settling and emotions calming, I thought now would be a good time to assess Dr Copper and whether our bullish long-term outlook remains intact.
Keep Your Eye on the Long-Term Trend
As you can see, the April sell-off meant another failed breakout for copper. This marks the THIRD successive ‘failed’ break for copper in the last five years.
I’ve circled each one on the chart below:
| |
| Source: Trading View |

The first was in 2022, then in 2024 and then our most recent test in late March. Each has been a test of copper’s historic 2011 top (far left), the peak of the last commodity boom.
But another failed breakout has probably pushed many investors out of the copper market, who’ve become fed up with it coming tantalisingly close to a breakout but failing again.
But it’s important to understand that building up to these events takes time.
On all accounts, copper’s set-up appears remarkably similar to what has happened with gold.
Like copper, gold tested its 2011 all-time highs THREE times before finally breaking out in early 2024.
And like a slingshot with stored-up energy, gold’s ‘breakout’ sent prices vertical last year:
| |
| Source: Trading View |

Copper: On Track for a Breakout in 2025
So, do we have a potential repeat pattern forming in the copper market?
As I’ve said many times in the past, gold often leads in commodity bull markets.
And as you can see on the chart above, gold tested its cyclical high from 2011 THREE times before finally breaking higher in March 2024.
This is precisely what’s happening with copper today.
Copper HAD to hold its long-term trend amid the market blow-off in early April.
And as you can see, despite shedding the bulk of its 2025 gains and losing as much as 9% in one trading session last month (red dot), the trend remains firmly intact:
| |
| Source: Trading View |
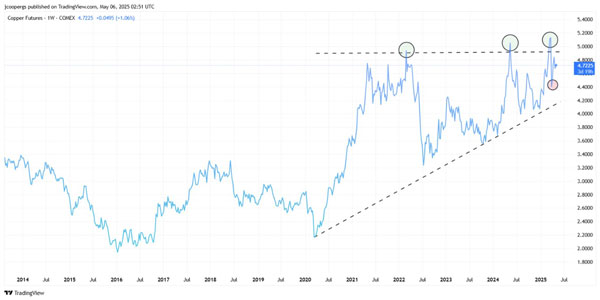
A resilient 5-year pattern that’s resisted a Chinese real estate collapse, a persistently strong US dollar, and long-term malaise in global growth.
Copper, the world’s most crucial ‘growth’ commodity, continues to weather these macroeconomic headwinds.
For these reasons, I suggested copper would (once again) be up for this latest ‘tariff challenge’. And so far, that’s proving correct.
Putting all the news aside… Trump tweets, China/US discussions, etc., etc. —in my mind, the most important thing to watch is the copper chart, the grand scale pivoting buyers against sellers.
If the trend continues, there’s every chance we’ll see another retesting of the highs in 2025—perhaps not imminently, but at some point later this year.
So, despite all the market confusion, Dr. Copper’s prognosis remains healthy.
Which means… holding firm on your copper stocks!
Until next time,
Regards,
 |
James Cooper,
Editor, Mining: Phase One and Diggers and Drillers

Comments