

Silver investors often wonder when they’ll see US$100 silver. It’s currently worth US$23–24 an ounce. This would mean a potential rally of over
300%.
But when will the rally come?
That question has stumped the silver-stacking community for years. There are a myriad of factors at play and no one can grasp which ones to track. Silver has rallied and dipped and is yet to break a new record high, unlike most metals.
Let’s check out the price history of gold and silver with the following figures going back to 2000:
|
|
| Source: Thomson Reuters Refinitiv Datastream |
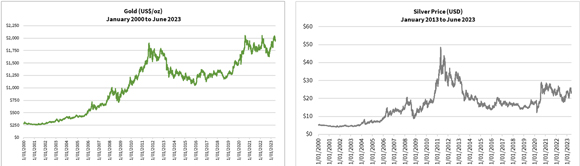
It’s clear that gold has had a much better run than silver over this period. Gold had a fantastic rally from 2000–11. Despite giving back half its gains from 2012–15, it broke new records in 2020. The last two years have been volatile, but gold held its ground.
On the other hand, silver went parabolic from 2009–11 but gave back much of its gains. It dipped hard in early 2020 before rallying by almost 140% in five months. However, it’s still trading at half its all-time high.
But there’s more to it than that.
These figures don’t account for the changing value of the US dollar.
The dollar has rallied by almost 50% in the last decade, based on the changes in the US Dollar Index [DXY]. So, you can’t really compare the prices in 2011 to today.
Here are the figures showing the US dollar-adjusted price history over the same period:
|
|
| Source: Thomson Reuters Refinitiv Datastream |
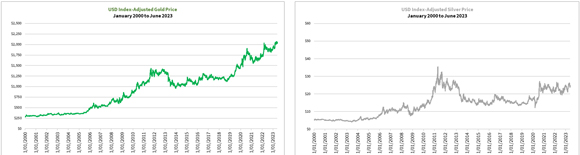
While the shape of the US dollar-adjusted prices of gold and silver is similar, notice the 2009–11 rally in gold and silver is less pronounced. This is because the US dollar was worth less back then.
The US dollar-adjusted price of gold peaked at $1,400 an ounce in 2011, and silver at $35 once you’ve accounted for the US dollar’s value.
Based on this, gold is almost 50% more valuable now than it was back in September 2011. Silver is now trading at a 30% discount to its all-time highs in April 2011.
So herein lies the puzzle — is gold overvalued or is silver undervalued? Or is it somewhere in between?
Let’s look at this puzzle and consider it from a few different angles.
Price manipulation: fact or fiction?
Silver attracts as much interest as it does controversy. It’s sought after for its versatility, being the shiniest and most conductive metal.
However, the price of silver is a contentious issue.
Many are aware that commodity prices aren’t set by the simple rule of supply and demand arising from the purchase and sale of physical metals from mining companies to smelters, wholesalers and jewellers. Rather, major financial houses such as JP Morgan, HSBC, Goldman Sachs, Barclays, etc. play a significant part in setting the prices by way of digital contracts traded on the commodities exchanges and the derivatives markets.
A decade ago, there was an Amanda Lang documentary on the market manipulation of metals by these institutions. These institutions stockpile a lot of physical metals and can use their proprietary trading desks to move prices at whim. For years, there was a lot of talk about price rigging. Sadly, the documentary showed that while regulators talked tough, they were unwilling or unable to follow through with appropriate actions.
But this has changed over the last three years as government regulators came down on the banks that manipulated the prices and supply, handing out hefty fines in the process.
In August 2020, Scotiabank was convicted by the US Commodity Futures Trading Commission (CFTC) along with the Department of Justice (DOJ) for manipulating the precious metals market and fined US$127 million (AU$170 million). In September 2020, the CFTC, DOJ and the Securities Exchange Commission (SEC) also found JP Morgan guilty of the same, though involving both the precious metals and interest rate futures markets. The bank paid a US$920 million (AU$1.3 billion) fine. Three senior executives were separately indicted on federal charges, convicted in August 2022 and are awaiting sentencing.
That said, we can’t lay all the blame on these bullion banks. They may have put more than a thumb on the scale. But within every conspiracy, there must be some basis for the participants to play into it.
So, we’ll delve into the possible relationships by which the prices are set, thereby gaining insights to help us invest better!
The disconnect between the relative abundance, production and price of silver and gold
Let’s start with the relative price of gold and silver. Here’s a chart showing the gold-silver ratio since 1990:
|
|
| Source: Thomson Reuters Refinitiv Datastream |
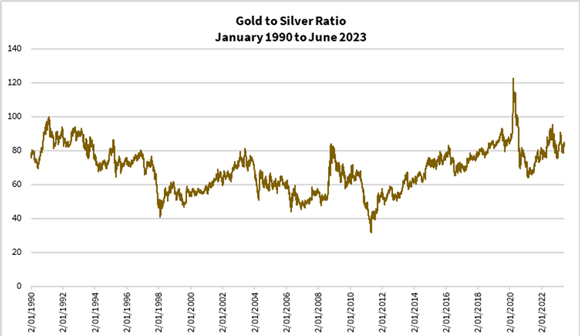
The gold-silver ratio has varied widely from 31–121, with an average of 68–70.
In turn, you might logically assume that the relative abundance or mining production of gold to silver is around 1:68–70.
Is that the case?
According to Visual Capitalist, gold’s abundance on the earth’s crust is around four parts per billion while silver is around 75 parts per billion. This implies silver is 18–20 times more abundant in nature than gold.
As for mining production, Statista shows gold production in the past 10 years ranged from 2,800–3,300 tonnes while silver production over the same period ranged from 24,000–27,000 tonnes. This suggests a ratio of 10 units of silver produced to one unit of gold.
From these results, you can infer that either gold is overvalued or silver is undervalued.
This is the key premise by which silver enthusiasts conclude that silver is deeply discounted. That’s why they claim that silver should be worth much more.
But is this the full picture?
Should you now stack more silver and expect a big payday soon?
We’ll unpack more of this in a couple of weeks.
Stay tuned!
God bless,
 |
Brian Chu,
Editor, Fat Tail Commodities

Comments