It looks like disaster was averted this week with the Evergrande situation going onto the backburner and the FOMC meeting ensuring the market that taper is coming, but not for a few months yet.
But don’t think for a second that Evergrande is now fixed, and the problem doesn’t exist anymore.
The next due date for a coupon payment is 11 October. So the issue will raise its head again around then. Keeping an eye on other property developers in China between now and then is probably a good idea.
It looks like we are racing towards a tapering announcement at the next FOMC meeting in November, with asset purchases probably ending around the middle of next year. At the very least, I think it means the vertical rise in asset prices will find it harder to continue beyond the end of this year.
Increasing volatility
We could be in for a period of volatile sideways motion for a few months as the market decides what to do next.
I think the main point is that the easy money has been made and the next six to 12 months will be harder to navigate.
I look at multiple time frames to build a picture of what the market is doing. Currently the daily and weekly charts are negative while the monthly remains firmly bullish.
We could see the weekly chart flip to positive next week and then the rally will continue. But until then I will reserve my judgment and remain a little wary that more selling could be coming.
The S&P 500 has sold off to major support around the 100-day moving average. It has bounced off that level each time during the rally since the COVID crash.
Time for a bounce?
|
|
| Source: CQG Integrated Client |

The odds would have to favour a nice bounce from here and if we get a weekly buy pivot confirmed next week, then it’s party time again. That will occur on a weekly close above the high of this week’s trading range.
But I need to see that weekly buy pivot confirmed first. I wrote this article on Thursday due to the long weekend, so I don’t know what happened during the Thursday and Friday sessions in the States.
If we don’t get that weekly buy pivot confirmed next week and the 100-day moving average doesn’t hold, then there is a good chance we will see further strong selling pressure.
But even if we do see that selling pressure, with the 100-day moving average breaking and a short-term panic erupting, there is still plenty of major support beneath the market.
Discover our top three ASX-listed pot stocks in 2021. Click here to learn more.
Long-term trend is up
The key long-term trend that I keep an eye on is the 10-month exponential moving average (EMA) versus the 20-month simple moving average (SMA).
I use the exponential moving average for the shorter time frame because it is more responsive, and I use the simple moving average for the longer time frame because it is showing the mean or average price over the last 20 months. It’s similar to the concept of the point of control that I often discuss.
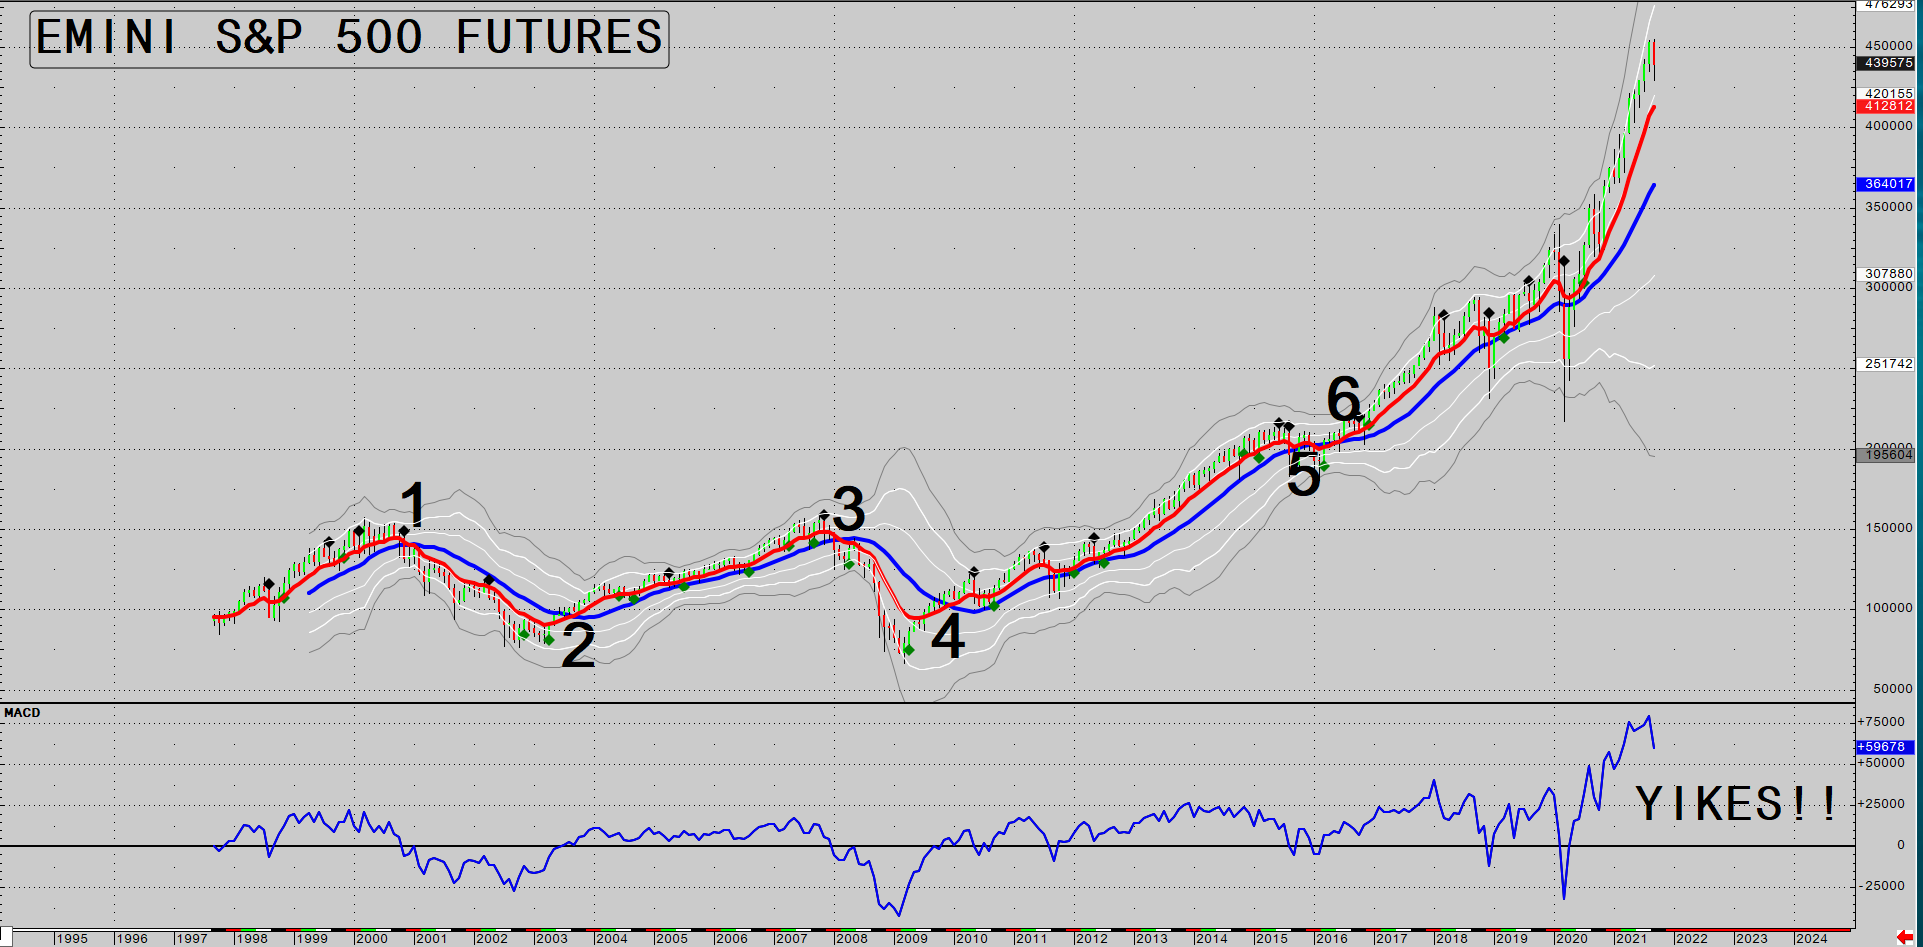
You can see in this chart of the past 25 years trading that it has picked both crashes and recoveries beautifully. I have numbered each time the moving averages crossed.
Long-term trends
|
|
| Source: CQG Integrated Client |

Over the past 25 years that moving average combination has only given one false signal. Not bad going.
When an uptrend is strong prices will often revisit the 10-month EMA and bounce off it.
The current uptrend has been so powerful that the 10-month EMA is miles away from where we are currently trading.
It is down at 4,127, which is 6% below the current price of 4,392 in the E-mini S&P 500 futures.
The market could drop 6% in a straight line and still look like it’s in a strong uptrend on the monthly charts.
Overstretched
Another thing to think about is the fact the current price has exploded away from the 20-month SMA, which is a very rare occurrence.
I have added in the MACD indicator at the bottom of the chart to show you how far away the current price is from the 20-month SMA.
Blast off
|
|
| Source: CQG Integrated Client |
This doesn’t predict a fall in prices right away, but it does warn you that things are overstretched and a mean reversion event towards the 20-month moving average is coming at some point.
That’s why I am still bullish overall, but I am responding to the short-term weakness in the weekly charts and taking a few profits off the table in case it is a hint that there is more selling to come.
None of us know what’s coming around the corner. Looking at the charts has nothing to do with reading tea leaves and trying to predict the future. It’s just about building up a sense of the current state of play to help guide your decisions.
Watch my Closing Bell video below where I show you the S&P 500 chart in more detail. I also have a look at the Australian dollar, gold, and oil — and give you two stocks that could benefit if oil prices continue rallying as I expect.
Regards,
 |
Murray Dawes,
For Money Weekend
PS: Watch the latest episode of my series ‘The Closing Bell’ on YouTube. Click here or the thumbnail below to view it.
|
|