In today’s Money Weekend…RBA blinks…short squeeze or trend?…stocks react…and more…
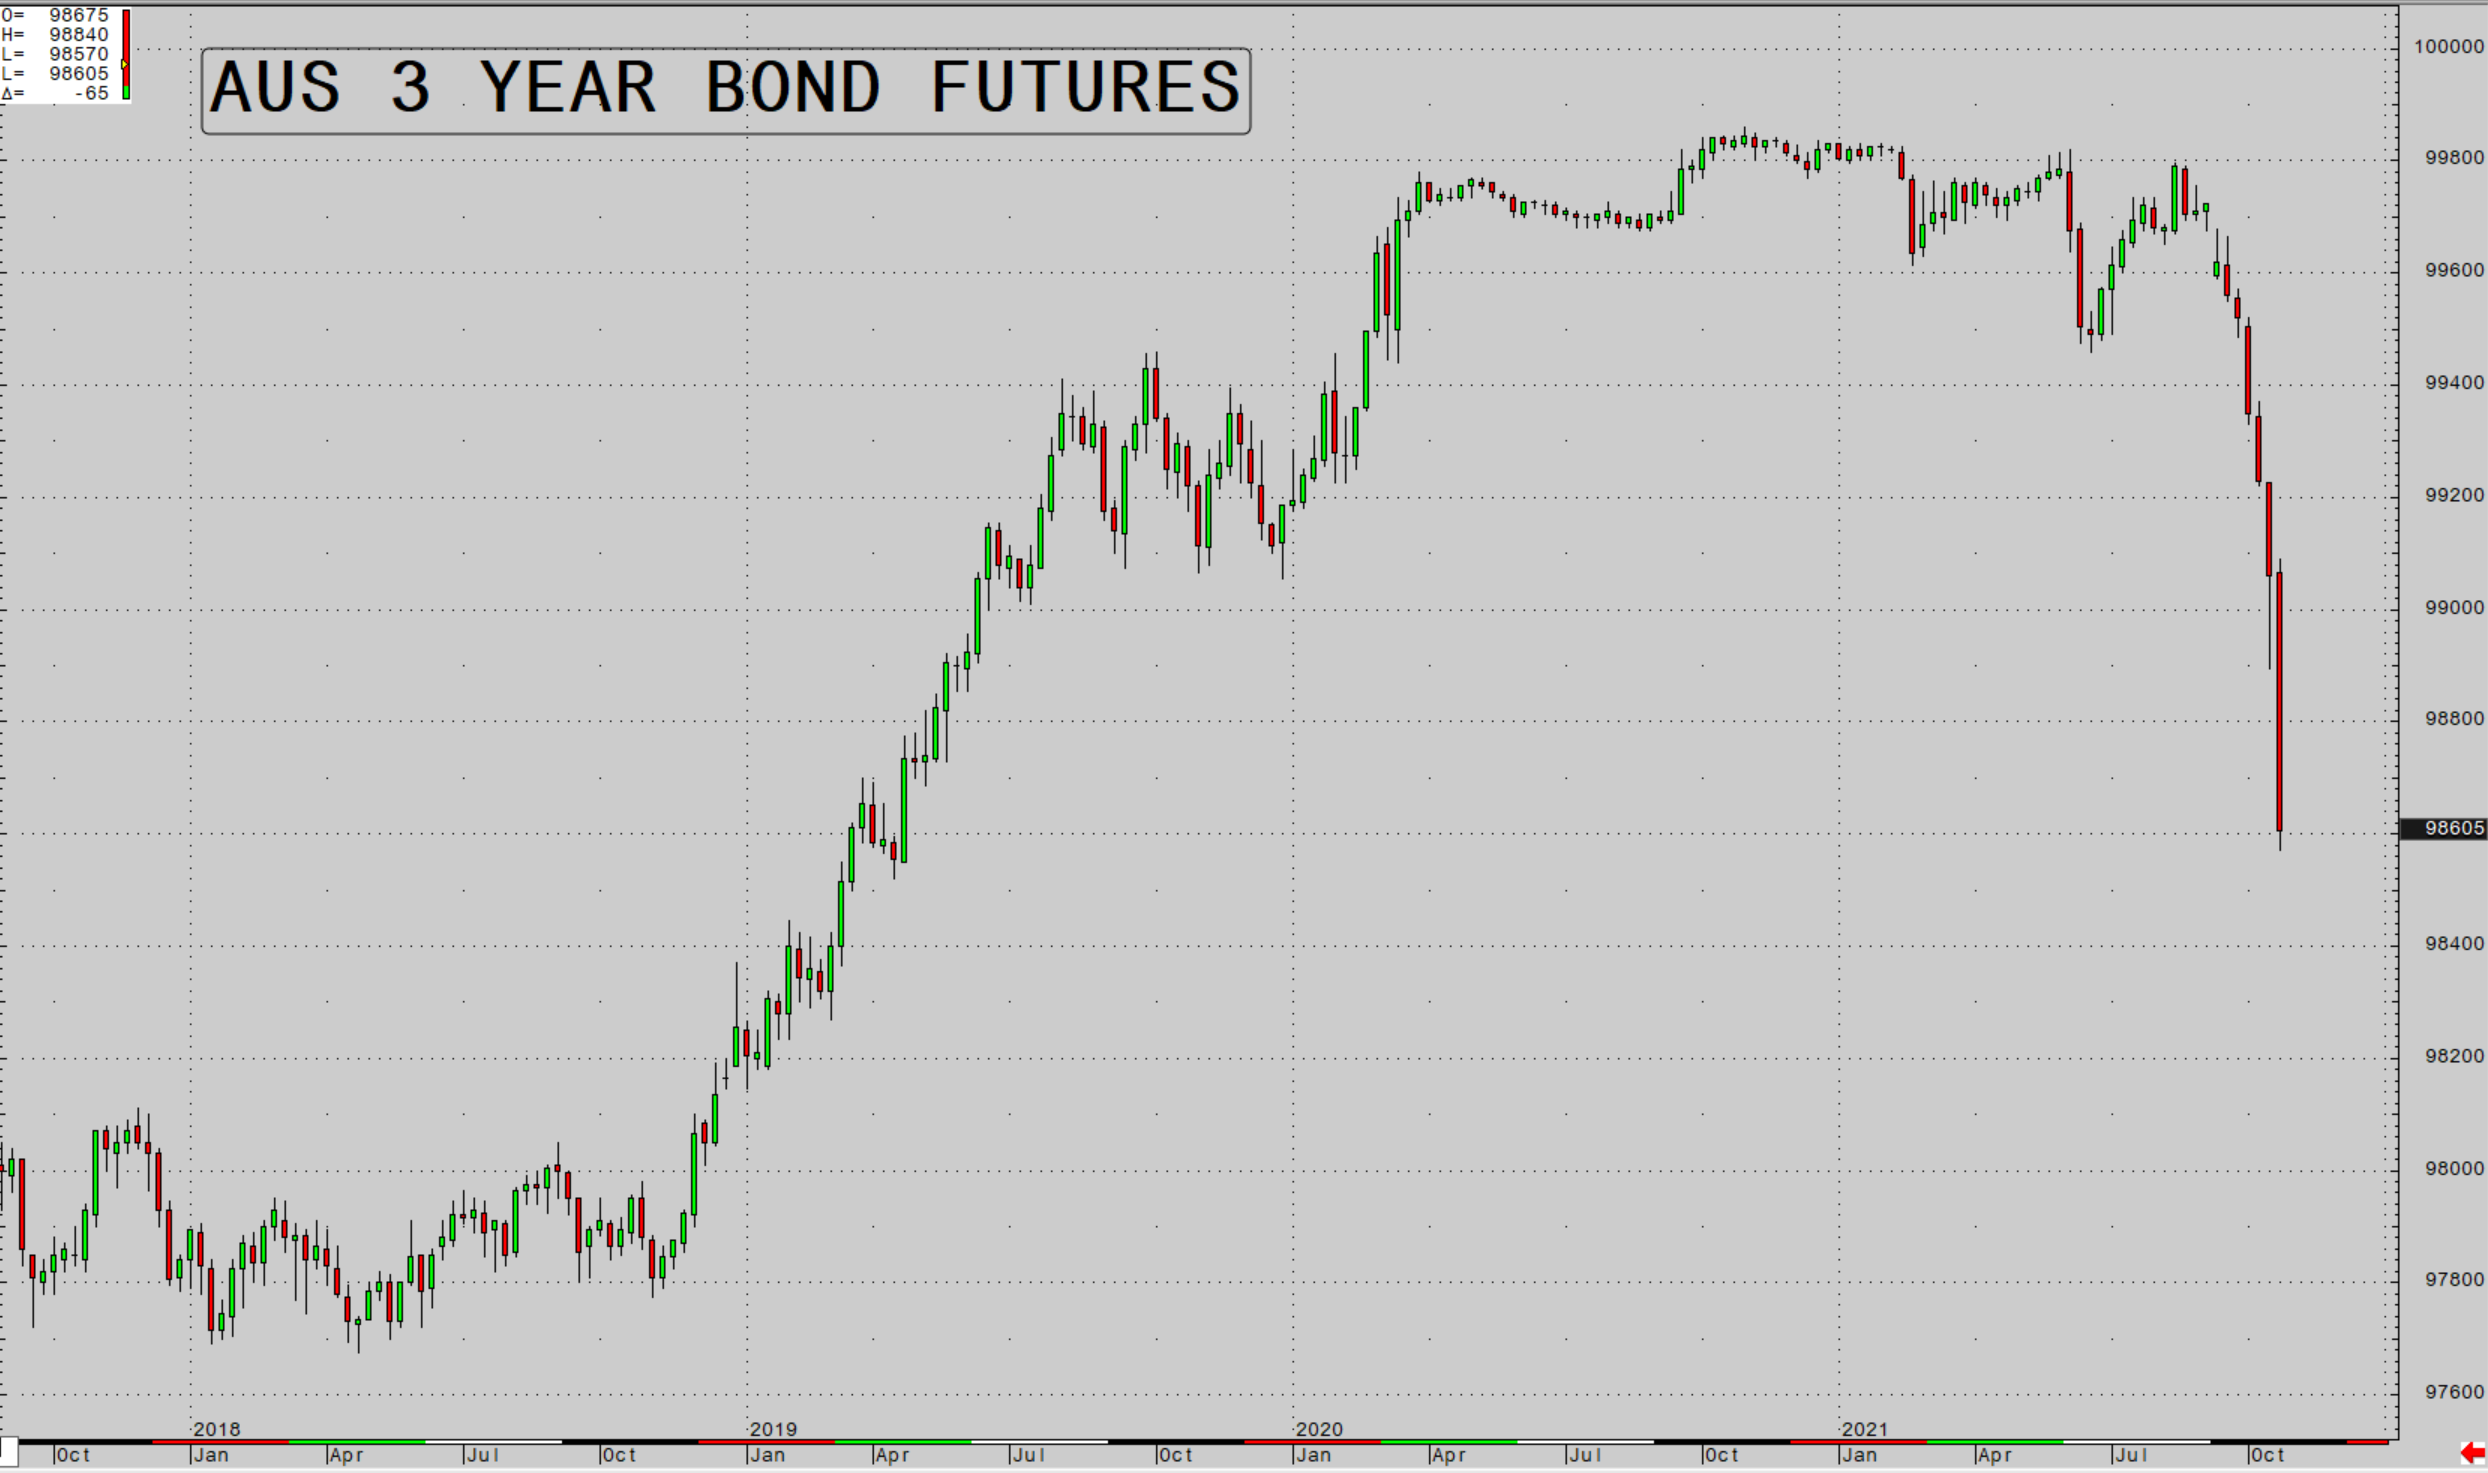
Of course, the big news for the week was the crazy moves we saw in bond markets around the world. Australia featured prominently with the short end of the yield curve spiking after the RBA didn’t step in to support the yield on the April 2024 bond.
There would have been plenty of traders piggybacking the RBA and expecting that their positions were protected by the RBA’s promise to keep yields around 0.1% for the foreseeable future.
Having the RBA back up your trading strategy is easy money. Until it isn’t…
The rush for the exits was swift, and I’m sure there are a few traders still licking their wounds.
But it isn’t just the short end of the yield curve that is behaving strangely.
As the odds of a taper in the US increase, short-term yields are rising (as expected) because the prospect of rate rises in the next few years is increasing.
But long-term rates are going in the opposite direction. Instead of rising, as inflation figures continue to come in hot and future rate rises get priced in, yields are falling.
It’s only been a few weeks since the odds of a taper happening have gone through the roof, so it’s still early days. Perhaps the rally in the 10-year bonds is a momentary short squeeze and soon enough they will start to sell off again (yields increasing).
How to Limit Your Risks While Trading Volatile Stocks. Learn more.
Short squeeze or trend?
Let’s have a look at the Commitment of Traders (COT) data to see if we can pick up some hints about what’s going on.
The Commodity Futures Trading Commission (CFTC) publishes the COT reports to help the public understand market dynamics. Specifically, the COT reports provide a breakdown of each Tuesday’s open interest for futures and options on futures markets in which 20 or more traders hold positions equal to or above the reporting levels established by the CFTC.
The most recent data is from 19 October, which is a bit out of date but is the most recent one available. They would’ve released another one last night, so you could check it out for yourself here.
You scroll down to the financial section and open the ‘long format’ document where you can search for the market you’re interested in.
10-year US Treasury COT data — 19 October
|
|
| Source: www.cftc.gov |
The different types of traders are listed across the top, and then you can see the size of their long and short positions (including spreading). On the next line you can see the change in their respective positions from the prior week.
The first thing to note is that institutional asset managers are evenly poised in their position with about 1.5 million contracts long and short. They were adding to their long and short positions from 12–19 October.
Leveraged funds are quite long 10-year bonds, but they were aggressively selling out of long positions during that week. The yellow highlighted section above shows you they are long nearly one million contracts but sold out of 107,778 contracts over the week (circled in red below highlighted number).
It’s the ‘other reportable’ and ‘nonreportable’ positions that are quite short US 10-year Treasuries.
As the CFTC site says:
‘Reportable traders that are not placed into one of the first three categories are placed into the “other reportables” category. The traders in this category are mostly using markets to hedge business risk, whether that risk is related to foreign exchange, equities or interest rates.
‘This category includes corporate treasuries, central banks, smaller banks, mortgage originators, credit unions and any other reportable traders not assigned to the other three categories.
‘The long and short open interest shown as “Nonreportable Positions” is derived by subtracting total long and short “Reportable Positions” from the total open interest. Accordingly, for “Nonreportable Positions”, the number of traders involved, and the commercial/non-commercial classification of each trader are unknown.’
The blue circled numbers above show you the short position for the reportable and nonreportable positions. You can see that the nonreportable positions are quite short 10-year treasuries overall. They have a 600,000 contract short position, versus a 300,000 contract long position.
The red circled numbers below the blue circles show you that there was short covering of positions going on from 12–19 October. ‘Other reportables’ covered 25,000 short contracts and ‘nonreportables’ covered nearly 6,000 short contracts.
There isn’t a smoking gun in the information above, but it does tell us that traders are quite short 10-year Treasuries, so it is worth keeping an eye on the COT data going forward to see if the bulk of the buying is based on short covering or increasing long positions.
If it’s short covering, there is a chance the rally runs out of steam at some point and the selling returns.
Stocks react
As I was writing this article, news came out that the RBA had once again failed to step into the market to support the bonds out to three years.
Three-year bond futures are selling off again and the stock market seems to be reacting, with the ASX 200 down 60 points.
Aussie bonds in freefall
|
|
| Source: CQG Integrated Client |
We have the FOMC meeting next Tuesday and Wednesday. The outcome of that meeting and the way bonds react around the world across the whole yield curve will be interesting to watch.
Grab your popcorn.
|
|
Check out my Closing Bell video below where I outline why there is still a heightened risk of a correction in stocks. Click here or the thumbnail below to view it.
Regards,
 |
Murray Dawes,
For Money Morning
PS: Our publication Money Morning is a fantastic place to start on your investment journey. We talk about the big trends driving the most innovative stocks on the ASX. Learn all about it here


