
In today’s Money Morning…a repeat on the cards?…how to swing trade…what asset ‘won’ the 1970s, and what could do the same today?…and more…
My colleague over at The Daily Reckoning Australia, Callum Newman, wrote to subscribers of his premium trading service last week, saying:
‘The market is selling down currently.
‘The momentum traders and breakout boys run scared when this happens.
‘We don’t have to.
‘We can keep our eye on upcoming catalysts — and use the sell-off to get in at better prices.’
I had a little chuckle at this line as I wasn’t sure if Callum was having a sly dig at trend traders such as myself and my co-editor here at Money Morning, Murray Dawes.
I’ve emailed Callum to find out!
But regardless, he has a point.
Right now, the market seems directionless. Moving up some days, then down the next.
Most investors hate that and it’s certainly no good for momentum and breakout trading strategies.
For most, the black and white of bull and bear markets — trending up or trending down — makes much more sense. Which is why a lot of people panic sell on the down days, then FOMO buy (fear of missing out) back in on the up days.
They’re trying to catch the next clear trend whether up or down.
But what if there isn’t one, at least for a while?
If that’s the case, then it could be time for the swing traders to make hay.
I’ll explain what I mean by that shortly, but first I want to talk about the decade where this was the strategy to use.
We start in the Swinging Seventies…
A repeat on the cards?
There’s a lot of chatter around right now that says market-wise, we’re going to see a repeat of the 1970s.
This isn’t a good thing.
As Kevin McCreadie of AGF Management recently warned:
‘What investors don’t want to have happen again, however, is a repeat of the 1970s, when commodity prices climbed dramatically, the economy sputtered, and stagflation took hold.
‘Yet, this is a very real possibility. In fact, if energy prices continue to rise like they have of late, it could have a negative impact on consumer spending and the trajectory of the economy.
‘In this environment, commodity stocks may still do well, and defensives like consumer staples and utilities may benefit, but it’s a tough slog otherwise and not a great environment for investors.’
The ‘70s were a bit of a lost decade for investors.
Check out the chart of the S&P 500 over that time:
|
|
| Source: MacroTrends |

This is not the kind of 10-year chart you’ll see hanging on the wall in any financial planner’s office!
We’ve been conditioned in recent decades to think over time markets only go up. The conventional thinking goes, ‘Sure, there’ll be volatility in the short term, but over the long haul, markets always go up.’
But as the ‘70s showed, this isn’t always the case.
It was a decade of long sideways movements.
And in the chart, you can see it actually went slightly backwards as the economic toils of the time (inflation and debt — sound familiar?) took their toll on profits.
Which brings me to swing trading…
How to Limit Your Risks While Trading Volatile Stocks. Learn more.
How to swing trade
Swing trading is a strategy to try and buy the short-term lows and sell the short-term highs. You’re catching the ‘swings’ — or changes — in direction, and most trades only last a few days or a few weeks at most.
You don’t need a clear market direction to make money this way. You just need to understand short-term psychology.
Now, there are a few different methods to use here.
For example, Callum Newman uses an understanding of upcoming value catalysts to pick up good stocks on the cheap. This is deep detective work.
But a more general trading tool you can use is called the RSI indicator.
RSI stands for Relative Strength Index and most charting packages will include it as standard. It helps you identify when the market — or an individual stock — is overbought or oversold.
A swing trader does the opposite of the FOMO buyer or panic seller I talked about at the start. They essentially buy the dips and sell the rips.
This chart below shows you how the RSI is used:
|
|
| Source: The Robust Trader |
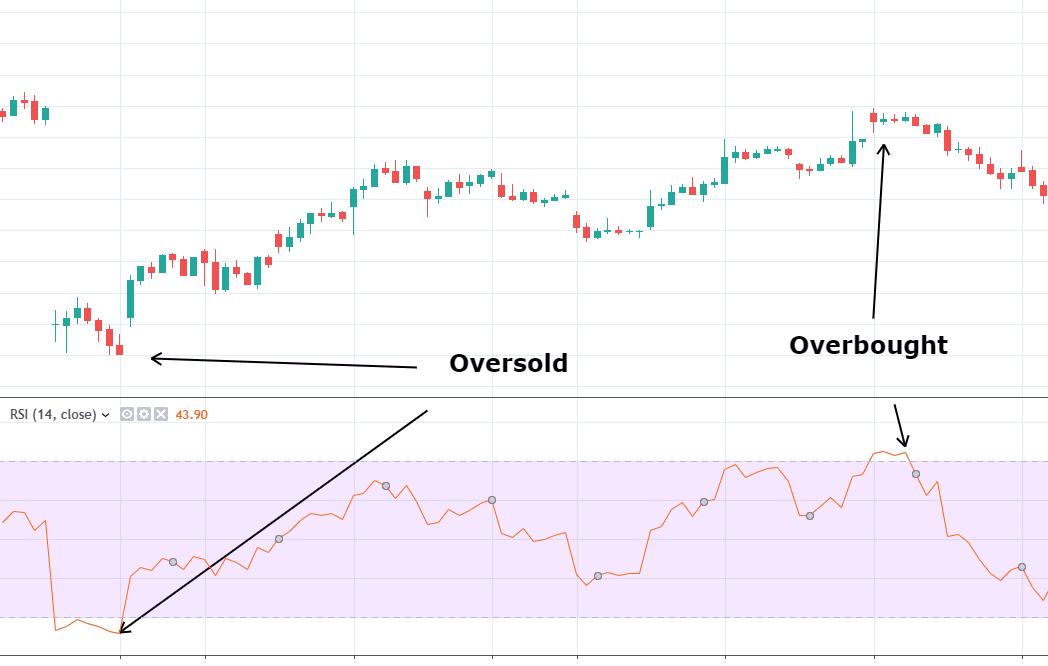
The bottom panel shows the RSI indicator, and the top panel shows the price.
As you can see, when the orange line goes above the ‘70’ level, it signifies overbought — which means you should sell.
And vice versa on the ‘30’ line.
If you marry that up to the price on the example, you’ll see it’s a method to eke out regular trading profits, though, like any trading strategy, it’s never a sure thing.
However, 99% of trading success comes from knowing the type of market you’re trading in. So if we do get a 1970s resurgence — a sideways trending market — this could be something to add to your toolbox of trading tricks.
What asset ‘won’ the 1970s, and what could do the same today?
While stock markets were in no man’s land for much of the 1970s, there was another asset that did trend strongly higher.
And that was gold.
Check out the chart:
|
|
| Source: MacroTrends |

As you can see, gold went on a huge run.
The catalyst for the move was President Richard Nixon’s move to effectively end the US dollar’s historical link to physical gold in 1971.
For my money, we’re seeing very similar conditions to that today, with many countries experiencing hyperinflation, unsustainable debts, and currency debasement.
Like the 1970s, that potent mix could be good for gold and gold stocks.
But for my money, it’ll be even better for Bitcoin [BTC], which is a technology-based money, suitable for the digital era we live in.
A few ideas for you to consider…
Good investing,
 |
Ryan Dinse,
Editor, Money Morning
PS: DO YOURSELF A FAVOUR AND WATCH THIS. This video shows Michael Saylor, CEO of MicroStrategy — a company that holds 121,044 bitcoins worth around US$6.9 billion — explain bitcoin’s monetary properties on the Tucker Carlson show in the US. It may be the most succinct summary of why we need bitcoin that I have ever heard. And I’ve heard hundreds of hours of bitcoin discussion.
