



The BRICS group (Brazil, Russia, India, China, South Africa and others) has been the perennial bogeyman of our geopolitics for two decades now.
The threat of new world orders, currency revolutions, and multipolar regimes has kept fringe pundits and feckless international bodies busy.
In reality, little has changed on the world stage. With the group’s next summit just weeks away, I want to look at whether that story could change.
Today, I’ll cover what the bloc looks like. And tomorrow I’ll cover the asset class that stands to benefit as the bloc evolves (hint: it’s gold).
The term BRIC was first coined by a Goldman Sachs economist in 2001. That was a full five years before the group decided to meet for the first time on the sidelines of a UN meeting.
Those haphazard beginnings foreshadowed how it’s functioned since.
A broad mishmash of ideas and positions that amounts to a hedge against US power and a marriage of convenience rather than shared values.
And yet, the group’s members now stretch across Asia, Latin America, Africa, and the Middle East. Beyond anything else, this has been its greatest success.
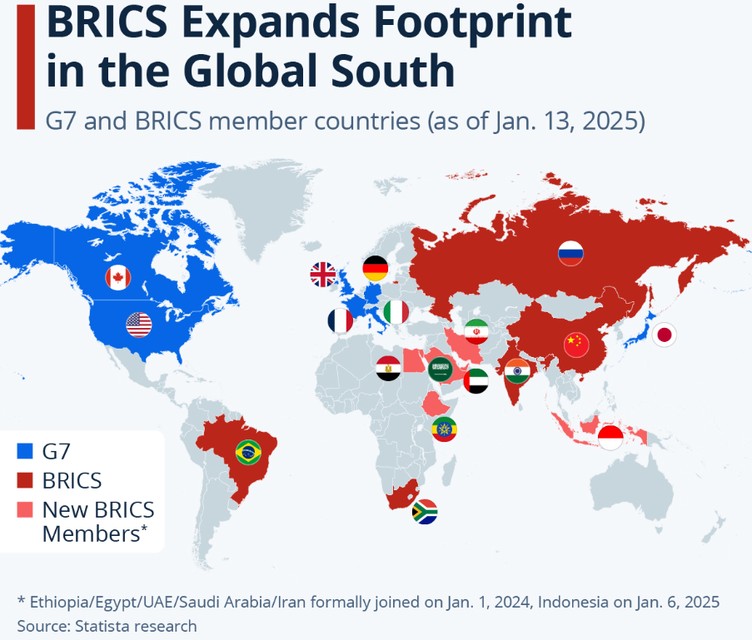
Source: Statista, 2025
[Click to open in a new window]
This growing roster has bolstered the bloc’s economic heft, with it now home to around half the world’s population and a growing share of global economic output.
Power to the people?
How you define that economic power tends to bend to your politics. Here’s a view of individual countries compared with Europe and the US.
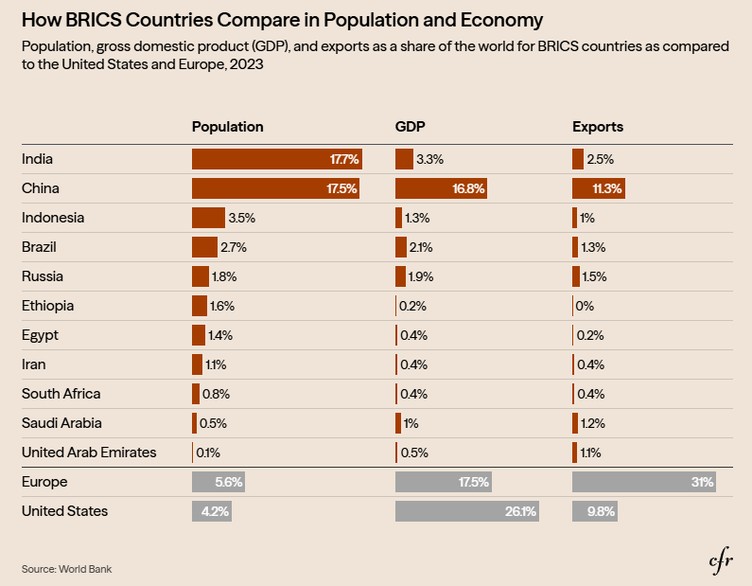
Source: Council on Foreign Relations — World Bank
[Click to open in a new window]
Collectively, BRICS is projected to reach around a third of total global GDP by the end of the decade — with the lion’s share coming from China.
Compared to the G7’s roughly 45% of global output with less than 10% of the world’s population, the wealth disparity is stark.
Per capita, the gap is starker. The G7 sits around US$69,000. BRICS, generously counted is closer to US$8,500.
So, in the sense of buying things abroad, servicing debt, funding institutions, and wielding currencies like a sword — the West still holds sway.
Yet if we consider how much a group can actually build, feed, mobilise, or produce — its industrial base — the West is falling behind.
This is often measured through ‘Purchasing Power Parity’ (PPP), a figure that adjusts a country’s output for local price levels and measures what its economy can buy at home, rather than its market exchange value.
And in these terms, BRICS passed the West in 2019.
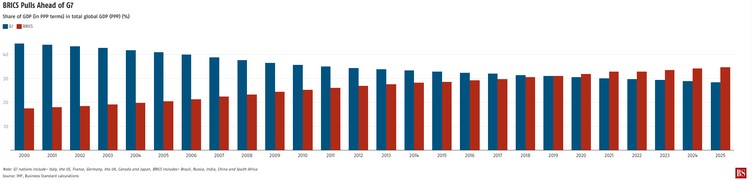
Source: Business Standard
[Click to open in a new window]
Nothing earth-shattering here; we’ve watched this transition for years.
It’s what Western pundits called ‘the Asian 21st Century’ a decade ago. The shift that spurred Obama’s failed Pivot to Asia in 2011.
Or, in Eastern terms, the revival of the Maoist slogan by Xi Jinping, ‘the East rising and the West declining’.
Trading game
What is perhaps more significant has been the large internal trade shifts.
Trade within the BRICS bloc has increased 13-fold since 2003.
You can see the changes in total figures below. Larger blue nodes represent total export size, while the thickness of yellow lines scales with export values between nations.
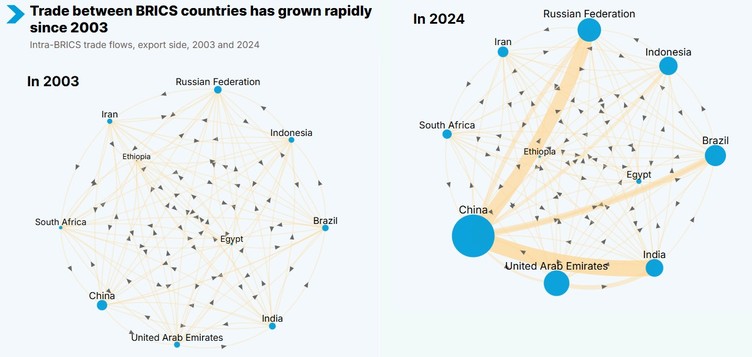
Source: United Nations 2024
[Click to open in a new window]
This internal trade and cooperation have only been accelerated by Trump’s recent tariff regime. Though the response so far reflects just how internally incoherent the group is.
Apart from a weak joint statement, it’s been national responses, not bloc-level ones. And among members, intra-BRICS trade still faces higher average tariffs than trade among OECD members.
BRICS members charge each other average tariffs of roughly 8%. The OECD (minus the US) charges 1%.
The bloc built to protest Western trade barriers is eight times more protectionist internally than the club it defines itself against.
Yes, that US exclusion is doing a lot of work, but I use that simply because Trump’s tariffs have been so sporadic.
One only has to look at the recent spat with Canada to see how hard it is to track the tariff rate on any given day.
In my opinion, this kind of tariff bullying is doing BRICS’ work for them.
Insecurity will naturally push nations into the bloc’s fold. Not that BRICS nations have been spared Trump’s ire, many were among the hardest hit.
But the growing club provides important resilience for nations whose trade and finances have been determined by the Bretton Woods system and the West more broadly.
According to BRICS, more than 30 additional nations have now formally applied or expressed interest in joining the bloc ahead of the upcoming summit in September.
Hosted by India, the 18th Summit is said to be focused on ‘Building Resilience and Innovation for Cooperation and Sustainability’.
The usual meaningless word salad. But inside those meetings runs a thread I’ll pick up tomorrow.
De-dollarisation.
BRICS’ attempts to shift away from the world’s reserve currency have taken many different forms.
But its most recent initiatives put it on a path that could see Aussie investors benefit more than most.
That’s what I’ll cover tomorrow.
For a sneak peek, you can follow the story of twelve barely reported words spoken in a Beijing lecture hall back in 2013.
Those words ultimately lead us to where we’re going next.
Regards,

Charlie Ormond,
ATLAS and Altucher’s Investment Network Australia




Comments