
I’ve received a number of emails from subscribers over the past few weeks.
It seems you want to know more about the 18-year cycle. Specifically, why is it 18 years?!
The answer is incredibly powerful. And potentially hugely profitable.
But fair warning: You might have a hard time believing me.
That’s because the answer — the missing piece of the cycle puzzle that not many in the mainstream know about — is both incredibly simple and (on the surface, at least) absurd.
But before I get to that, let’s go back to basics. Most people who work in the real estate industry are aware the market moves in cycles.
Hence the well-worn concept of a ‘property clock’.
The majority will tell you the ‘property cycle’ is approximately seven years.
If you consider the mid-cycle slowdown (the recession halfway through the 18-year cycle), then seven years (with a variation of a year or two here and there) is not a bad assessment!
But without analysis of long-term historical data, you would never ‘see’ a long cycle. And collecting historical real estate data is not easy.
In Australia, sale records were not readily available until around 1970.
This was when electronic data processing came into vogue.
This is why you (as a buyer/investor) cannot access the sales history of an individual property address prior to this date.
For researchers who have tried to go back further and establish an index (to 1880, where the current historical analysis reaches), the data has been painfully collated from two sources.
- Sale prices — which were reported post-1950 and recorded in two major newspapers (principally The Age and The Sydney Morning Herald) by sales agents. Hence, we have greater info regarding Sydney and Melbourne.
- Prior to this, the only source we had was asking prices from real estate newspaper advertisements. Not perfect, but was something to go by, at least.
Even so, an Australian real estate agent would unlikely recognise an 18-year cycle from this data alone.
Let’s take a brief look at why…
The history of the 18-year real estate cycle in Australia
In recent decades, Australia has experienced synchronised downturns with the US.
These downturns were preceded by rampant real estate speculation.
I have pointed them out on the chart below.
|
|
| Source: LF Economics |
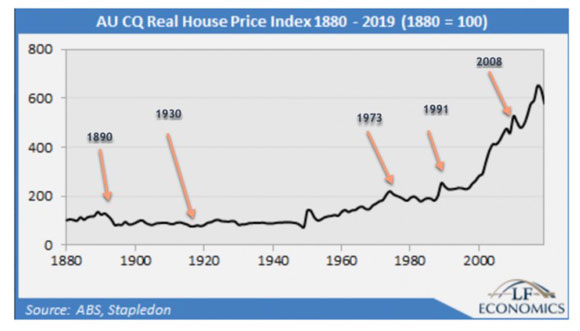
The most recent major — land-based-led — recessions occurred in 1973, 1990/91, and 2008.
Note the timing between downturns…18 years. (Meaning the next major land-based-led recession should be after the peak in 2026.)
As you’ll recall, Australia managed to avoid a recession and a major property downturn in 2008.
This was thanks to a big dollop of fiscal and monetary stimulus, as well as exposure to China’s economy by selling our mineral wealth.
Still, it was undoubtedly a difficult economic period.
Prior to 1973, it is hard to chart a set 18-year pattern in Aussie property prices.
We had a synchronised downturn with the US in the 1890s.
A spectacular run-up in land prices (due to the gold rush) produced a depression that hit Australia with a vengeance in 1893.
It resulted in major turmoil, widespread strikes (by shearers and miners), and numerous bank closures.
You can read in detail about it in Michael Cannon’s excellent book The Land Boomers.
A riveting period of history.
It produced the worst five-year hit to property prices we have on record.
Between 1891 and 1896, median prices dropped by 34.9%!
The Great Depression in the 1930s was less severe. Still, there was a fair degree of land speculation in the lead up. Property prices fell 18% in 1930.
This is the worst one-year price decline on record.
Prices from 1930 to the mid-1950s were less prone to cycles.
During the Second World War (1939–1945), a number of government policies kept a stem on inflation.
In 1950, when the removal of post-war rent control produced the biggest one-year rise in prices we’ve ever seen — a whopping 132.5%.
After 1950, migration increased, and prosperity improved. More women joined the workforce.
Neo-liberal economics took over.
This eliminated land (as a factor of production) from the economic textbooks.
Mortgage debt soared.
Restrictive land policies resulted in massive land price inflation on the outskirts of cities.
Tax policies favoured landlords and penalised workers.
As a result of all this, our real estate cycle now synchronises nicely with an 18-year pattern, history repeats!
The 18-year cycle in the US and elsewhere
Dr Homer Hoyt was a US economist and real estate speculator.
He identified the 18-year real estate cycle in his dissertation 100 Years of Land Values in Chicago (1833–1933) (published December 1933).
Hoyt was an economist and real estate speculator.
His analysis goes into great detail.
Hoyt carried his research back to 1833.
U.S real estate valuer Roy Wenzlick did similar in his NY Times best-selling pamphlet produced in 1936 entitled ‘The Coming Boom in Real Estate and What to Do About It’.
Of course, this is not where the real estate cycle started.
In his book The Power in the Land, UK economist Fred Harrison identifies ‘the first long business cycle in the history of industrial society’ between 1795 and 1815.
US economist Mason Gaffney links major historical events, such as the 1720 Mississippi bubble (The South Sea bubble), to land speculation.
In Europe, French scholar ME Levasseur (1892) published data on Paris land prices between 1200 AD and 1799, noting similar cyclical patterns.
All of this is interesting enough. However, that doesn’t mean that an economic 18-year cycle cannot occur without real estate speculation.
Nor does it mean that real estate is the root cause of the cycle.
Speculation on real estate, and the credit creation that backs it, merely increases the volatility of the cycle.
As a result, it increases the possibility that the economy will suffer a major depression.
Let me state that again because it’s very important.
What I’m saying is that real estate speculation doesn’t cause the cycle. It merely reinforces it and carries it to an extreme.
It is at the extremes that depressions occur.
What is the root cause of the cycle, then?
Why is it 18 years?
The answer is fascinating…
To read more of this article and find out WHY the real estate cycle works like clockwork — chiming to an 18-year pattern, and more importantly, exactly how you can profit from it — sign up to Cycles, Trends & Forecasts today!
Best wishes,
 |
Catherine Cashmore,
Editor, Land Cycle Investor

Comments