

On Wednesday, I pointed out that we’d taken some profits on our oil and gas stocks for our paid readership group.
As I explained, at some point, investors need to think about turning paper profits into real gains.
And the only way to do that is to sell, or at least, partially sell your holdings.
You might recall, too, that I believe the next opportunity could shift back to the miners.
I’ll give you the name of one commodity to look at next week.
Time to Sell O&G and Buy Miners?
Well, it might not be so simple, let me explain…
If you believe the war premium on oil has peaked, it may be time to shelve this opportunity for a little while. That’s what I explained in your prior edition.
But whether you sell O&G stocks or hold for the long haul really depends on your investment strategy.
Sure, this sector may have peaked, for now, but I doubt we’re sliding back to $50 crude anytime soon.
The crisis in the Middle East is destined to leave a lasting legacy on the global economy, exposing deep vulnerabilities in energy supplies.
Oil supply gluts envisioned by the International Energy Agency (IEA) simply don’t exist; if they did, we wouldn’t be facing record oil prices.
As far as I can tell, that narrative has been put to bed. Oil markets are far more constrained than analysts predicted. And this economic danger has been laid bare for all to see.
And that’s why I don’t believe we’ll see a severe correction in the oil market, even as the dust from this war begins to settle.
Bottom line: I suspect the oil market will continue to play a central role in markets over 2026.
Which brings us to another important data point…
The Seasonality of O&G
To get some insight into the potential trajectory of this market over 2026, I thought I’d share a graphic on the long-term ‘seasonality’ effect of oil and gas stocks:
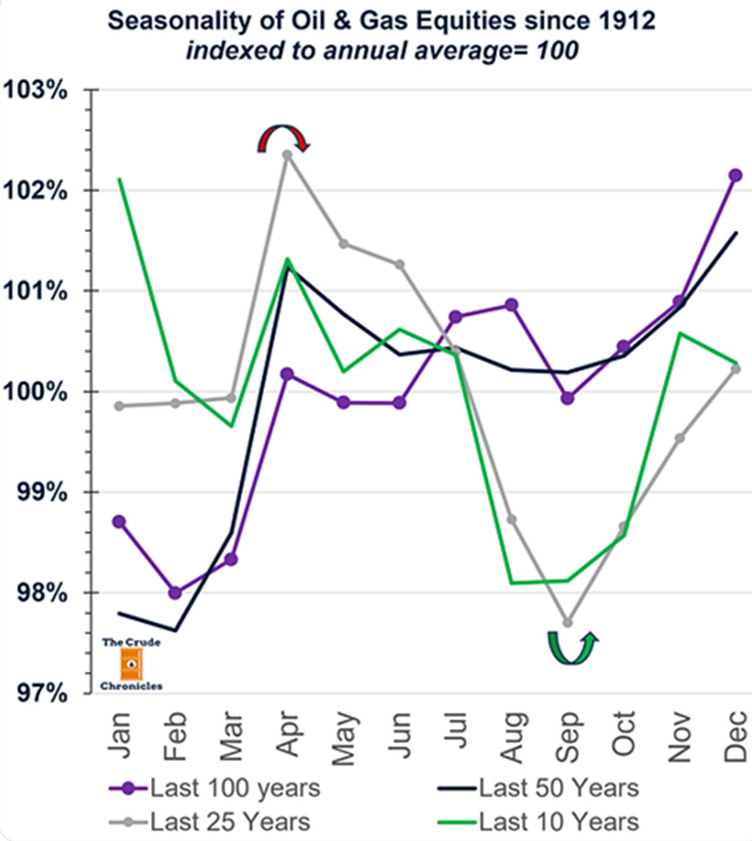
Source: The Crude Chronicles
If you’re not familiar with the term, seasonality in commodities refers to predictable, recurring price patterns driven by annual cycles in supply and demand.
Think of the planting/harvest seasons in key growing areas around the world; these timelines impact grain prices. Or the impact on gas demand in the Northern Hemisphere through the changing seasons.
These trends occur at similar times each year and can help traders anticipate shifts, such as winter natural gas spikes, agricultural price drops after harvests, or autumn gold demand.
With that in mind, take a look at the chart above: oil and gas stocks show a strong correlation with an April peak, followed by a hefty decline into September.
From there, these stocks tend to run up into a strong finish in the final months of the year.
To be clear, looking at the seasonality effect of commodities doesn’t give us a black-and-white answer of where prices will head. These historical trends offer probabilities, not certainties.
And they need to be overlaid with the current price action.
So, what clues does it offer?
If the oil and gas market follows its historical seasonality, we could be on track for a peak sometime in April. That would align with an easing of hostilities in the Middle East.
In all honesty, we’ve probably seen that already.
But as I mentioned earlier, that doesn’t mean an end to the long-term opportunity in these types of stocks.
If we account for this seasonality, oil could be due for near-term weakness, but it could finish strongly towards the end of 2026.
If prices continue on this historical trajectory, I’ll be looking to get my paid readership group into more O&G positions mid-year on the back of any significant decline.
Bottom line: Understanding the seasonality driving commodity prices offers another handy tool for investors. It’s something I look at, alongside price action and the underlying fundamentals driving individual companies.
This is all about stacking as many probabilities in front of you as you can.
If you want that on your side as an investor, you can join me here.
Until next time.
Regards,

James Cooper,
Mining: Phase One and Diggers and Drillers

Comments