
Markets are tense.
The US S&P 500 Index is stuck firmly in a holding pattern, hovering below its all-time highs.
The rally has slowed… Over the last four weeks, the index is up just 0.46%.
The next move is critical.
This retesting of all-time new highs comes at a precarious moment in world affairs.
The Middle East is on fire. And there’s potential for this situation to get much worse.
But rather than focus on what’s wrong with the world, I thought I’d spend today’s edition discussing strategy.
Specifically…
What techniques do I use for my resource advisory service?
As a geologist, you’d probably assume that I use an understanding of the rocks to pick mining stocks… And you’d be right!
After all, the rocks in the ground are the primary asset for mining and exploration companies.
But I’m certainly not the only geologist or mining engineer who’s pivoted into the world of investing.
In fact, fund managers and investment banks regularly employ (or are led by) mining professionals.
But I think you need more in your toolkit than just a technical background to recommend resource stocks; after all, this is one of the trickiest sectors to get right.
That’s why I’ve spent a lot of time digging into the weeds of technical analysis over the last decade or so.
That I feel gives me a significant advantage … using industry knowledge but overlaying it with an understanding of the charts.
I’d suggest any investor who takes a very pragmatic approach to selecting stocks start exploring the more obscure world of technical analysis.
And combining the two.
That’s what I share with my paid readership group, showing readers how to deploy both strategies to put more probabilities of success on their side.
So, how can technical analysis add value?
Well, let’s take an extreme example of how price action can allow investors to anticipate future trends or even major global events:
In the aftermath of the September 11 attacks, there was speculation that ‘insiders’ had advanced knowledge of what was about to happen.
Proof lay in the price action of American Airlines and United Airlines, the two companies whose planes were hijacked and crashed by terrorists.
A steep rise in put options in the days ahead of the event hinted that this was more than a coincidence. It followed the price action for these two companies.
However, we can see similar examples in markets all the time.
When a company’s share price falls AHEAD of its earnings release, that typically points to bad news.
Why?
Company insiders may be offloading stock before that bad news goes public, hence causing the share price to fall.
And the same can be said for a sell-off that happens AFTER a positive earnings release… Earnings are past events, and insiders already know what lies ahead.
If business conditions are turning sour, this last positive announcement may be used as their ‘liquidation event.’
An opportunity for insiders to exit while the rest of the market remains upbeat and unaware of the risks ahead.
Markets don’t play fair, and regulators can’t keep track of the thousands of trades happening every minute.
So, charts give you foresight that can’t be gained through fundamental analysis alone.
Here’s another example of how charts can boost your performance…
Imagine finding a producer with a track record of meeting guidance, strong operating margins, positive cash flow, and a long mine life.
But even then, the stock could be in a downtrend, making lower lows, especially if that commodity is out of favour.
That’s why I’d only consider adding the stock once the charts confirmed some type of ‘strength.’
That could be a sideways trend when other stocks in the sector are making new lows.
Capricorn Metals [ASX: CMM] was one example we added to the Diggers and Drillers portfolio, BEFORE gold stocks entered their bullish phase.
In 2023, many gold producers were in a downtrend.
Yet Capricorn was showing clear relative strength in the market, holding firm while many of its peers were making new lows.
That’s the consolidation phase (dotted line) I’ve annotated below:
| |
| Source: Trading View |
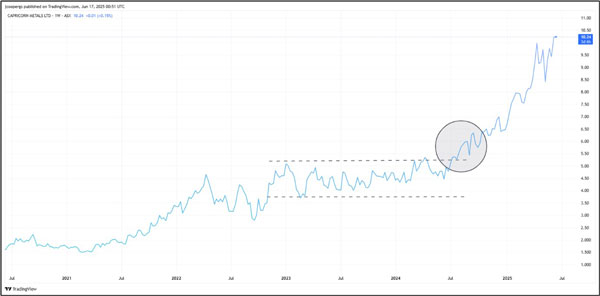
The company was emerging as a leader in the sector. And that was confirmed by strong fundamentals.
When gold prices turned up in 2024, Capricorn’s share price surged, maintaining its ‘leader status’ in the gold sector.
This is how you can ‘marry up’ technical analysis with a pragmatic understanding of the company’s fundamentals.
If that interests you, you can join me here to learn more about how we deploy these investment strategies.
Regards,
 |
James Cooper,
Editor, Mining: Phase One and Diggers and Drillers

Comments