
Last week’s better than expected inflation data out of the US saw stocks rise around the world.
Since that release, both the S&P500 and the ASX200 have jumped 2.6% (as at 19 July).
Let’s take a quick look at the numbers…
US headline inflation for the month of June fell to 3%, from 4% in May. Core inflation (all items less food and energy) fell to 4.8%, from 5.3%.
Annualising the last three months’ seasonally adjusted numbers, headline inflation is at 2.8% while the core rate is at 4%.
So inflation is definitely slowing. Despite this, the market hasn’t changed its tune on the rate hike front. There is a 99.8% chance of a rate rise when the Fed meets on 26 June.
Beyond that though, the market isn’t so sure. That could well be the last one.
Is this good news? Is ‘rates on hold’ the new ‘rate cut’ in the eyes of the bulls? Has the Fed pulled off the famed ‘soft landing’.
Look, anything’s possible. But the more I think about, the more I realise this ‘soft landing’ or ‘no landing’ bollocks is really just the market’s way of trying to rationalise a resurgent US stock market in the face of deteriorating economic data.
It’s certainly confusing. But that’s the market’s job…to confuse and confound. It makes you second guess yourself constantly and waver in your conviction. And it generally forces you to cave at the moment of maximum pain.
And right now, the bears are the ones feeling maximum pain. To be more precise, I’m talking about those bearish on the US market.
Let me explain…
Short squeeze?
The chart below shows the Commodity Futures Trading Commission’s (CFTC) weekly Commitments of Traders (COT) report of the net positions for “non-commercial” (speculative) traders in U.S. futures markets.
In English? It shows you how short term traders are positioned in S&P500 futures. At the start of June, traders were net short a whopping 434,000 contracts, the largest net short position in at least 8 years (see below).
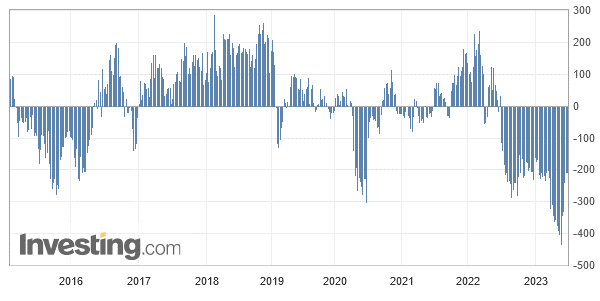
In the past six weeks, this position has been cut in half. As of Tuesday 11 July, traders were net short 207,000 contracts. My guess is that last week’s better than expected CPI release caused more short covering. We won’t get that data until Friday though, as the Friday release only reports on positions as at the prior Tuesday.
So that’s something to keep an eye on…
But looking at a chart of the S&P500, you can see how this short covering is fueling the ongoing rally. It started (the short covering, that is) at the same time as the S&P500 broke out above its January highs…
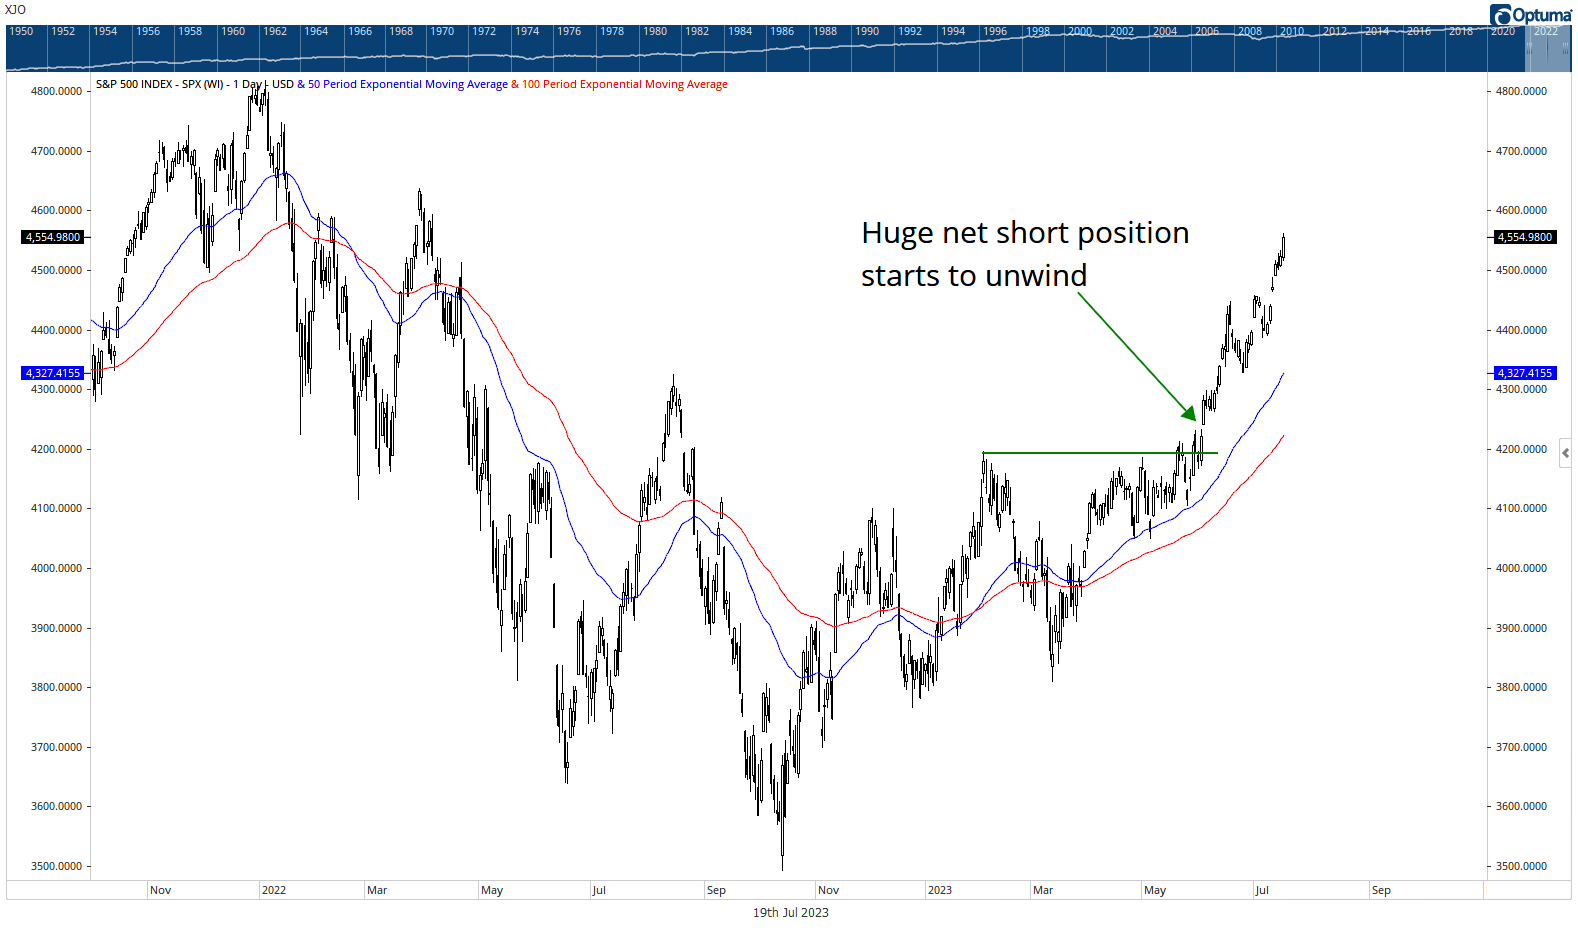
And it may keep on running until traders are effectively net neutral. That would be an epic short squeeze!
So, you have a US market driven in the short term by bullish sentiment (CNN Fear and Greed index in an ‘extreme greed’ reading for over a month) and moving relentlessly higher, which is freaking the shorts out and forcing them to cover…which in turn adds fuel to the fire.
A message to the bears: Stand aside!
Let the bullishness play out. It may take a few more days…or weeks…or a few more months. But wait for the market to tell you the buying power has exhausted itself.
And for the bulls, just understand that there is the little issue of fundamentals that doesn’t really support this rally. The lagged impact of interest rate rises will continue to bite. And rates will stay higher for longer.
Real rates a problem for bulls
This disconnect between the S&P500 and the interest rate environment is best reflected by the fact the real US interest rates remain at high levels, while the S&P500 keeps moving higher.
To give you some context around that comment, let me turn to co-host of the What’s Not Priced In podcast, Kiryll Prakapenka, who shared this nugget from Morgan Stanley in this week’s episode:
‘Notably, current price/earnings (P/E) ratios have decoupled from one of their most fundamental drivers—the 10-year US Treasury real yield. This rate is the basic building block for discounting future cash flows, especially for long-duration growth stocks.
“The current 10 year real rate is in line with last October’s cycle high, which correlated with a stock market trough and P/E ratios below 17.3. Today’s forward P/E ratio of 20 thus looks completely unjustified.” Shalett also said while “this time may be different”, market internals should not be this contradictory; whether a bullish narrative is correct or not, it should still “hang together”.’
As you can see from the chart below, real yields and the S&P500 are no longer ‘hanging together’. To be precise, the black line is the PRICE of Treasury Income Protected Securities (TIPS), a proxy for US real rates. Price and yields move inversely, so a falling black line means rising real yields, and vice versa.
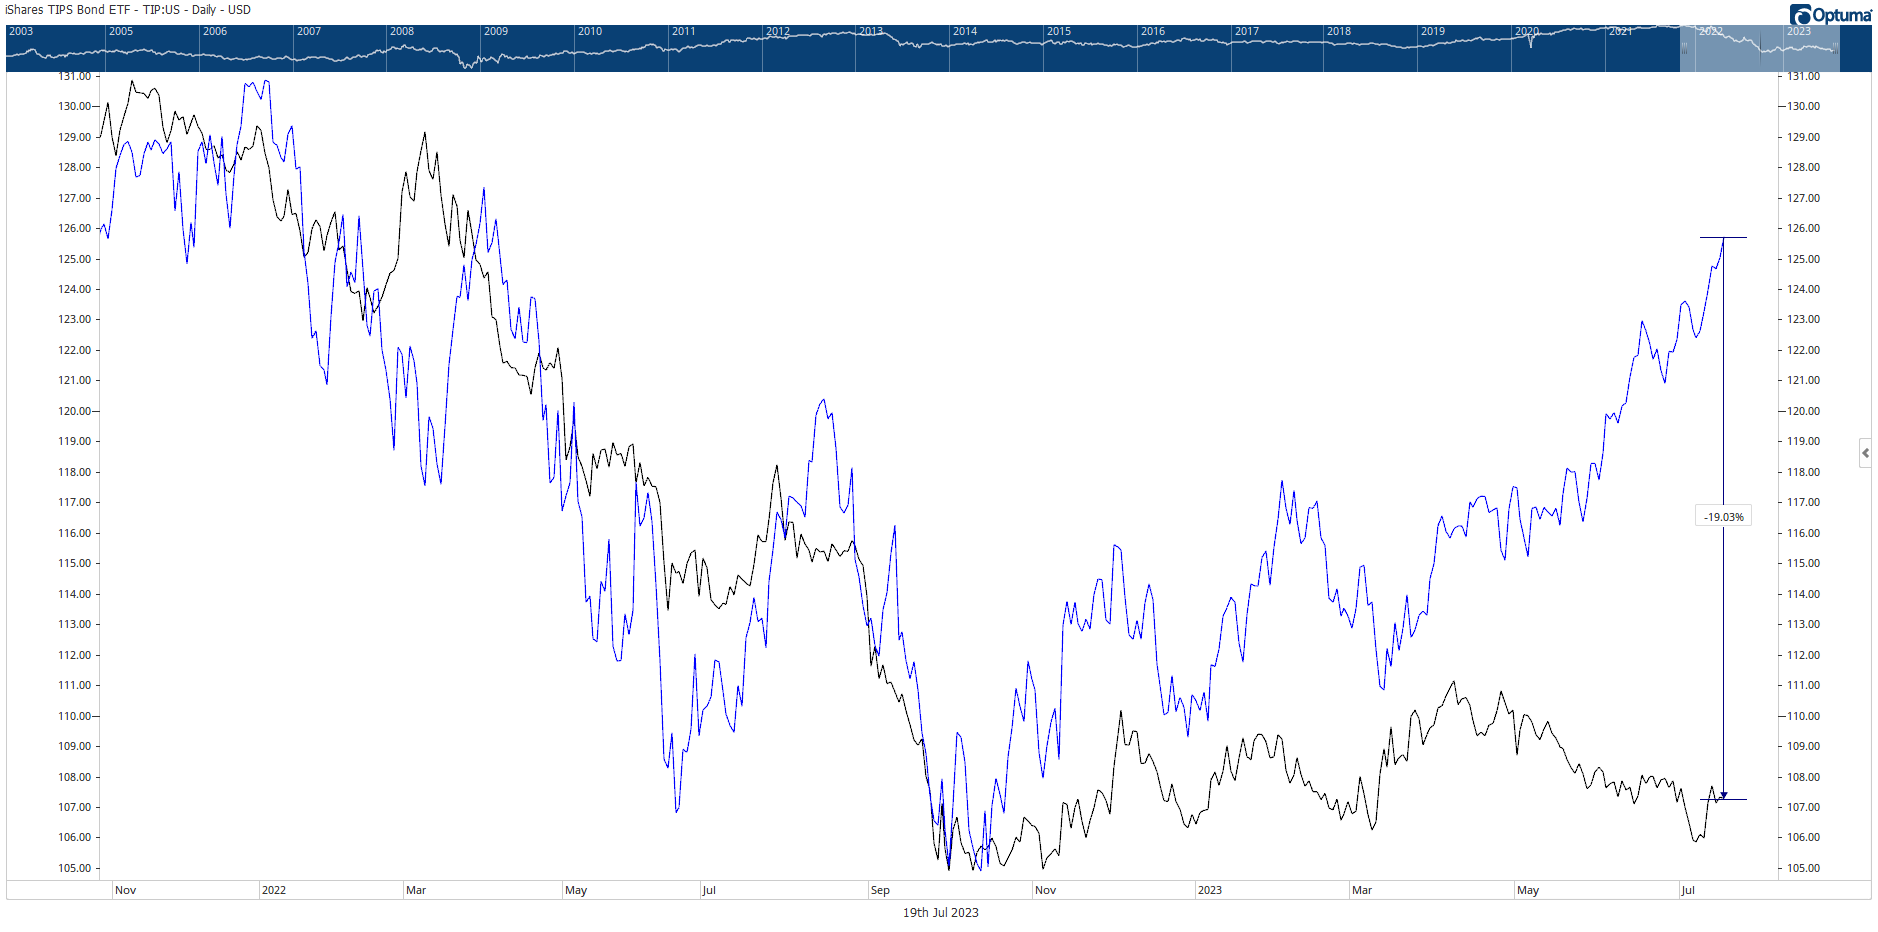
Over the past few months, there has been a clear disconnect between real yields and stocks. Real yields reflect ‘higher for longer’ interest rates. Surging stock prices represent ongoing bullish sentiment, short covering and a firming belief in the soft/no landing narrative/fantasy.
I’m a big believer in the wisdom of crowds. The market is nearly always smarter than you. But there are times when the madness of crowds takes over too. And while I think the Aussie market isn’t overly bullish or bearish right now, the US market on the other hand is living in some kind of la la land.
I think the right course of action here is to stay patient. Wait for the tide of bullish sentiment to turn bearish, and then get ready to buy when fear is the dominant narrative.
It sounds so easy. But much harder to do in the thick of it. Let’s see how things play out in the coming months and go from there…

Greg Canavan,
For Money Morning
