
Dear Reader,
Unemployment won’t be as bad as first thought, the Aussie media declared yesterday.
Treasurer Josh Frydenberg reckons the number of Aussies looking for work may peak at 8%, not 10% like first thought.
Of course, I find this figure impossible to believe.
For starters between JobKeeper and JobSeeker, more than one-third of the 12.5 million working age Australians are receiving some sort of government welfare.
In late May it was estimated that 3.5 million Aussies were or will access JobKeeper. And there’s roughly another 1.3 million Aussies accessing JobSeeker.
And those numbers still don’t give us the ‘full’ picture.
Rightly or wrongly, there are thousands of Aussies that work in the cash economy.
My chats with local business owners around my area suggest there are thousands of former employees working for cash. Making them ineligible for JobKeeper. And because of their Visa status here, I suspect many more can’t access the government handout with a fancy name.
Then, of course, there is the fact that I have little faith in the data produced by the Australian Bureau of Statistics. Given how Roy Morgan calculate unemployment, I’d wager their figure of 14.8% is closer to the truth.
The short version is, the numbers the government is feeding us don’t reflect the individual reality of what’s been taken out of the economy.
JobKeeper distorts the true impact of unemployment, and the methodology of the ABS is misleading.
Meaning that on paper Aussie unemployment sounds like it should be able to turn around a dime. When in reality, getting back to work may be a much slower process.
Australia isn’t alone, either.
The US is seeing unprecedented job losses as a result of the coronavirus.
But according to Jim Rickards, there’s another statistical category that’s even more important in forecasting economic growth…and the data isn’t looking good.
Read on for more.
| Until next time, |
| Shae Russell, |
This Is Catastrophic
In the US, total employment is back to levels last seen in the 1990s. It’s as if the economy had been on hold for three decades. The setback only took three months.
However, the person who has no job, but also does not claim to be seeking one, is counted in a different statistical category called the ‘Labor Force Participation Rate’ (LFPR).
The LFPR is calculated in a much simpler manner than the unemployment rate. Everyone who could perform a job (whether you’re looking for one or not) is in the denominator. Everyone who does not have a job (whether you’re looking for one or not) is counted in the numerator.
It’s basically a fraction of everyone who has a job divided by everyone who could have a job regardless of your intentions or motivations to get one.
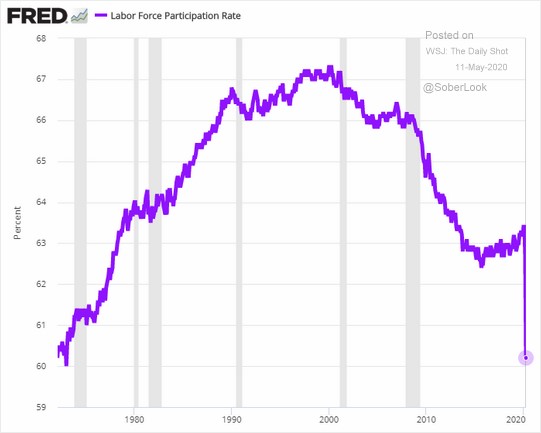
Here’s the chart:
LFPR 1970–2020, showing Wuhan virus impact
|
|
| Source: FRED |
Let’s start at the beginning
The steep increase from a 60% LFPR in the 1970s to an LFPR over 67% in the late 1990s basically represents the rise of women in the workforce and the rising workforce participation of the baby boomer generation.
Incidentally, the LFPR is never anywhere near 90%, let alone 100%. There will always be those who are not pursuing traditional ‘jobs’ for a long list of perfectly good reasons. These non-job holders could be students, homemakers, early retirees, convalescents, or ‘off-the-books’ handymen paid in cash who do not report the income.
An LFPR over 67% is considered quite high in a developed economy and a sign of economic strength. That’s where the US was in 2000 at the end of the Clinton boom years.
The LFPR then began a steady decline. This was attributable to both the 2001 recession and the 2008 global financial crisis. Also demographic factors came into play as the older baby boomers began to retire.
Declining health (due to obesity, diabetes, drug addiction, etc.) and increased incarceration rates pushed more and more workers to the sidelines. By 2015, the LFPR had fallen to around 62.4%. For the next five years, it moved in a narrow range between 62.4% and 63.5%, with a slight upward bias.
But then COVID-19 hit.
[conversion type=”in_post”]
Back to the ‘70s
Almost overnight, the Great Depression of 2020 slammed the LFPR down to 60%, about where it was in 1970. Again, it was as if the US economy had been transported in a time machine to where it was 50 years ago.
This news will get worse. The US Bureau of Labor Statistics (BLS), which computes both the unemployment rate and the LFPR, has admitted it cannot keep up with the sudden flood of applications for unemployment benefits and its own household surveys used to calculate the headline rates.
It has warned analysts to expect major data revisions in June and July when it begins to catch up with its backlog. These revisions will mean both higher unemployment rates and lower labour force participation rates. Both are bad news for US economic growth going forward.
Why the LFPR is key
Here’s why the LFPR is even more important than the unemployment rate in forecasting economic growth. There are several ways to describe and measure economic output. The standard definition of GDP is: GDP = C + I + G + (X – M).
In this equation, C is consumption spending (about 70% of the total in the US); I is business investment, including inventories (about 20% of the total); G is government spending (about 15% of the total); and (X – M) is exports minus imports, or the net trade surplus or deficit. This is usually a negative number in the US (a trade deficit) that reduces the total by about 5%. The sum of these factors is 100% of GDP.
Still, there’s an even simpler way to think about total output or GDP. Just take the total number of people working and measure the productivity of workers on average. That’s it. How many people are working and how productive are they? That’s all you really need to know. But what does it tell us about future GDP?
How the unemployment shock will sink GDP
Productivity doesn’t change a lot in a mature economy, but it can change. Lately, productivity has been declining slightly. It may have to do with an ageing demographic or the fact that we use a lot of ‘technology’ to waste time instead of getting real work done. This is one reason why economic growth has been slow for the past 10 years prior to the pandemic.
Therefore, the real driver of growth (if any) has been the size of the labour force. And that’s what the labour force participation rate measures.
Once you drop out of the labour force (regardless of the reason), your productivity drops to zero because you’re not working.
The sharp decline in labour force participation from 2007 to 2010 coincided with the lost output from the GFC and subsequent recession. LFPR rebounded slightly from 2010 to 2019, which was consistent with steady if unspectacular growth.
Now labour force participation has collapsed. The reported data has not caught up with the reality. LFPR is likely to fall further to 55% or lower. This is partly because some of those currently ‘unemployed’ will decide they are retired or can’t get jobs and simply drop out of the labour force.
Catastrophic consequences
These losses will not be temporary as unemployment sometimes is. These losses will be permanent as skills, social networks and references all dry up.
This is catastrophic. It means that even as businesses reopen and some of the unemployed get their jobs back, many others are never coming back to the workforce. Output will be permanently impaired even if productivity picks up a little.
The drop in LFPR has been a cliff dive. The economy is under water as a result and output will remain submerged perhaps for decades.
In a future edition of The Daily Reckoning Australia, I’ll explain further why the economy won’t bounce back quickly — even as individual businesses and industries begin to reopen their doors.
| Regards, |
 |
| Jim Rickards, |

Comments