Firstly, a bit of follow up from the last week’s piece, ‘Is Darwin Going to Boom?’.
Louis Christopher, founder of SQM Research, dedicated a chapter to every capital in his 2023 ‘Housing Boom and Bust’ report except for Darwin!
Still, where Darwin is mentioned, the forecast is dire…suggesting values could struggle to inch into positive territory, -5–0% for the year, with rents falling -3 to -5%.
I reached out to Louis for comment the next day. He’s on leave right now but was nice enough to reply.
It seems the SQM forecast rests on Darwin’s relatively recent recession prior to COVID:
‘In short, I’m not convinced the NT government had done enough to transform the economy.
‘And with Covid largely behind us, it’s likely all the same economic problems will shortly return…
‘But as they say, it’s just an opinion and they are entitled to theirs as I am entitled to mine.’
Louis has an astounding record of accuracy, but it’s hard to envisage his forecast playing out in the short term.
Darwin is now the third most expensive capital to rent a house in Australia.
From an ABC report:
‘...after a $70 a week rent hike coincided with her former partner moving out, these days it isn’t just enjoyment that keeps the single mother-of-one tending to her fruit and vegetable plants…
‘“We’re trying to grow our own food because we need to,” she says.
‘“I don’t have the luxury of going and buying whatever we want for whatever recipe we need — it’s more about what’s the cheapest foods that we can buy that are still healthy.”
‘“We live week-to-week, day-to-day, really,” Ms Buxton says.
‘My pay goes to rent, food, bills, and sometimes it’s not enough, and it doesn’t stretch that far.
‘Every week my bank balance goes back down to zero. Every week.’
Darwin’s property prices peaked in 2014 — as did rent prices.
In 2014, the median rent per week was $650. Dwelling values are still some 10% below that.
However, the median rental price at $615 per week is fast approaching the 2014 peak. It will likely exceed it over the next few months.
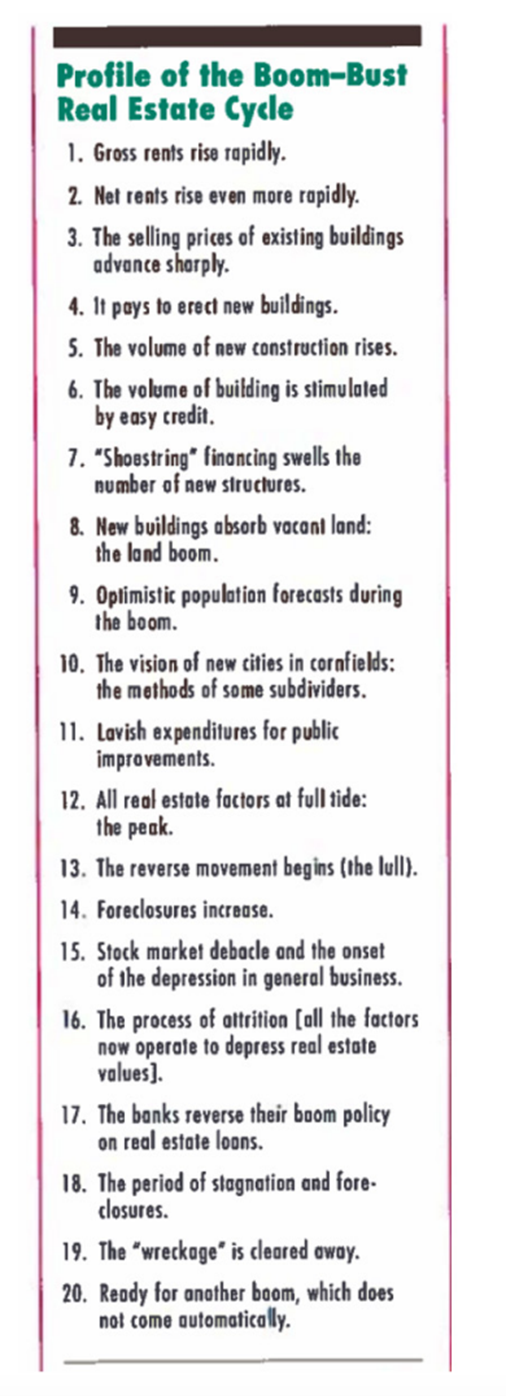
If you know your cycle history, you should be able to forecast what occurs next.
Remember, one of the first to identify the real estate cycle was Dr Homer Hoyt.
Hoyt was a US economist and real estate speculator.
In his classic book One Hundred Years of Land Values in Chicago (1833–1933), he uncovered five major real estate cycles.
These peaked and crashed in 1837, 1857, 1873, 1893, and 1926–29.
Hoyt showed the real estate cycle functioned like clockwork.
It followed the same pattern, in the same sequence, over and over…
And that pattern still stands today, with only minor adjustments.
Take a look:
|
|
| Source: Homer Hoyt — stages of the property cycle — Lincoln Institute of Land Policy |
The first two steps are the triggers:
‘Gross rents rise rapidly’ (followed by net rents).
This lights a few fires.
Firstly, it encourages those renters (that can) to become buyers, even if it means moving to less expensive regions — more on that later.
And secondly, the increased earnings (rent) of the land attracts a higher lending capacity from the banks.
The next step in Hoyt’s list is the consequence:
‘Selling prices of existing dwellings advance…’
According to Warren Ebert (CEO of Sentinel property group), who is currently investing big in the Northern Territory, right now, you can purchase existing units in Darwin at 30% of replacement cost.
That’s bullish for the established housing market.
The NT has a worker shortage and without stimulus to ignite building activity, it should be expected that prices will increase in 2023 through competition alone.
We’ll wait and see how it plays out, but my money is with Ebert on this one.
Speaking of finance…
Whilst interest rates are not the only influencer of property prices, demand from investors is currently being stifled by the mortgage serviceability buffer, which requires assessment some 3% above current lending rates.
As commented by my fellow Brit, Pete Wargent, in his daily blog the other week:
‘It’s very hard for investors to step up the plate, with the regulator requiring landlord mortgages to be stress-tested for an extraordinary 300 basis points lending assessment buffer, despite full employment, zero vacancy rates, and rocketing rents.
‘With the cash rate target now higher than the 3-year bond yield this makes zero sense after 300 basis points of hikes have already been delivered — it’s a nanny state setting which is crushing the rental market.’
(By the way, If you didn’t catch my recent interview with Pete on all things property and finance, you can tune in here!)
Whilst we shouldn’t fall into the trap of thinking that investor participation in the market is essential for an increase to the supply of rental accommodation (the demographic mainly purchases existing housing and without investor competition, it’s reasonable to assume that this would assist first home buyers to step in)…
…the rental crisis could place pressure on regulators to ease lending conditions.
It may not be an easy political move, but it wouldn’t be unprecedented either.
In fact, it’s something we would expect at this point in the real estate cycle, especially considering new home sales are down 23.4% in the previous quarter, and down by 29.1% in the same quarter in 2021.
That’s challenging the government’s plan to build one million well-located homes in five years. Something has to be done if the promise is to be achieved…
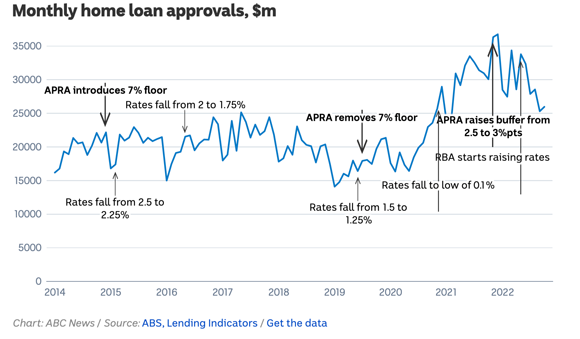
Looking back, the recent 2020–22 boom was due, in part, to the 2019 decision by APRA to scrap the interest rate floor on mortgage serviceability tests.
Meaning the lower rates went, the more purchasers could borrow without needing to meet a 7% interest rate buffer.
It was designed to pump the market following the sharp 2018 downturn and proclaimed by then-Treasurer Josh Frydenberg as ‘a positive development that will continue to spur lending growth across the economy’.
The floor was reintroduced as the housing boom was fizzling out in October last year.
An interesting piece in the ABC this week highlighted the consequence of the change and how regulation has affected the value of home loan approvals since.
‘The RBA has increased interest rates by 3 percentage points since the start of May.
‘That means even those very recent borrowers subject to the higher serviceability buffer have seen it totally eroded away. And the RBA said last week that it still “expects” to raise rates further.
‘Those who got their loans over the previous couple of years on a 2.5 percentage point buffer are now living an experiment.
‘Their monthly repayments are already higher than what they were tested to be able to afford…’
|
|
| Source: ABC News |
Regardless, lending criteria isn’t the only mover of the dial on property prices.
With global inflation easing, immigration pumping, and the prospect that rates may stay on hold when the RBA meets in Feb, we could see an improvement in market demand and prices by as early as the second quarter of next year.
Even so, tighter budgets are pushing investment into the more affordable regions of the major capitals — the outer suburban areas.
These are the pockets to target if you’re looking to enter the market and benefit when the market does turn.
The formula is simple. It’s gentrification at work.
Investment needs to be into an area where the population is increasing and available land supply is limited.
I refer to it as a ‘land-locked’ suburb.
An area where the surplus land is built out and to accommodate an increasing number of people moving in, the larger blocks are starting to be subdivided by developers.
Some of the drivers you should be looking for right now to identify these regions are tight and falling vacancy rates along with a low number of ‘days on market’.
Which brings me to some recent research by Domain.
‘Home buyers are snapping up properties within a couple of weeks or less in a string of affordable outer suburbs, new figures show.
‘In NSW, the fastest-selling suburbs were in western Sydney – Warragamba at an average 15 days on the market, followed by Wakeley and Carnes Hill at 18 days each, Domain research found.
‘In Victoria, Gladstone Park in Melbourne’s north topped the list at 17 days, followed by Ferny Creek in the east at 18 days and Officer South in the south-east at 20 days.
‘For Queensland, the quickest sales were in Boyland, Heritage Park and Kuraby, all at 18 days or less, while in Western Australia the fastest sales were in Merriwa, Lake Clifton and Kingsley, also 18 days or less. The national crown went to Tolmans Hill in Hobart at just eight days…’
I’d also suggest looking at the bigger cities in the regions.
You’ll find a wealth of free property data to assist you on the SQM Research website.
Until next time,
 |
Catherine Cashmore,
Editor, Land Cycle Investor


Comments