
Over the last few months, I’ve been writing about the need to focus on energy stocks.
I hope you’ve been paying attention because not many have!
Especially with the supposed oversupply in the oil and gas market. But as I’ve mentioned before, the price leads the news.
Official reports often don’t align with the reality on the ground. So, that’s why interpreting price action is critical.
Financial institutions, governments, and even the world’s leading energy agency (the IEA) continue to downplay the price of fossil fuels.
The narrative has been bearish.
But as I’ll show you, the price action has been decisively bullish… The trend towards traditional energy stocks is strengthening.
Fossil fuel companies have been among the best-performing stocks this year.
And that’s crystallising further despite the global market correction since late January.
Tech down. Energy Up.
As an investor, the key thing I look at is relative strength.
What do I mean?
Emerging bull sectors tend to decline less during market-wide sell-offs.
That’s why corrections can be incredibly useful in pinpointing where future strength sits.
So, with that in mind, how is the traditional energy market faring against this latest market sell-down?
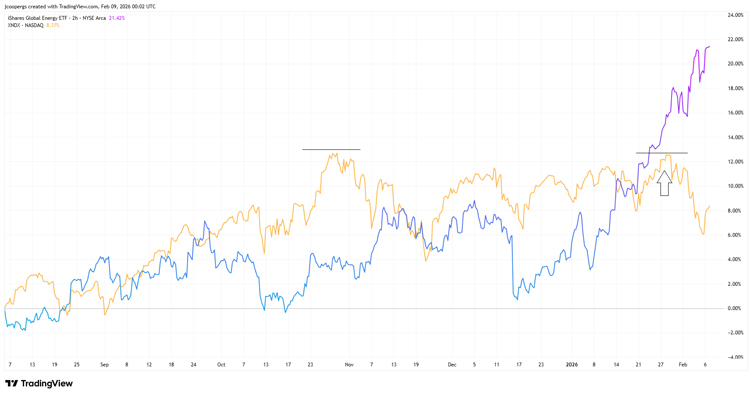
Well, here’s a chart comparing the Nasdaq 100 Total Return Index (orange) versus the iShares Global Energy ETF [NYSE: IXC], shown as purple:
Source: Trading View
[Click to open in a new window]
The Nasdaq 100 is made up of the world’s largest tech firms, like Google, Apple, Nvidia, and Amazon.
Meanwhile, the Global Energy ETF comprises oil giants such as Exxon, Chevron, BP, and Shell.
Two completely different business models, but two sectors potentially on very different long-term trajectories.
If you want to distil the price action from this chart, take a close look at where the strength is emerging… Energy.
So, when did this strength begin to crystallise?
Well, the market correction began in late January, which was also the top for the Nasdaq 100 (arrow above).
This top was a ‘testing’ of tech’s all-time high made in October 2025.
If you understand price action, you’ll know why that’s important.
Could tech continue leading the market into new all-time highs and break through the October resistance level?
We now have the answer… No.
Tech failed its critical technical resistance, meaning this sector is now cheaper than it was 5 months ago.
In other words, the sector that has dominated global markets for the better part of a decade is now drifting sideways, while other sectors, like energy, are moving upwards.
In terms of tech, it’s not strong. However, it’s not weak either. The coming weeks could be critical for understanding the tech sector’s long-term trajectory.
This will remain a volatile and uncertain time for investors focused on that market.
Which is why you should be laser-focused on sectors demonstrating clear strength: Energy.
You see, despite the global stock market correction that began in late January, the iShares Global Energy ETF hasn’t just held firm; it has surged against investor uncertainty.
The energy ETF is up almost 15% this year, while tech remains flat.
As I detailed last year, energy should be your focus as we head into 2026. And that’s exactly what’s playing out right now.
Did I have a crystal ball? No.
But I did have some useful charts to look through.
So, the bottom line is this: narratives, facts, and data are useful, but if they don’t align with the price action, they’re probably wrong!
If you’d like to find out more, you can do so here.
Until next time.
Regards,

James Cooper,
Mining: Phase One and Diggers and Drillers

Comments