
Around the World in 80 Days was an award-winning film in 1956 based on the classic novel of the same name written by Jules Verne and published in 1873. In a nutshell, a wealthy member of an exclusive London club makes a bet with some other members (worth about US$2.5 million in today’s money) that he can travel around the world in 80 days or less. I’ll leave the details (and the surprise ending) to those who want to watch the film.
Suffice to say our protagonist, Phileas Fogg, and his loyal valet hopscotch through France, Spain, Switzerland, India, Hong Kong, Yokohama, San Francisco, and the Wild West (including a Sioux attack) before sailing to Liverpool via New York and Venezuela. Fogg makes a mad dash from Liverpool to London to try to win the bet.
Travel is much faster today. I’ve flown around the world a number of times. It never took 80 days, but one journey did take 42 days. I started from New York with the Concorde to Paris, travelling at Mach 2.1 at 61,000 feet (who says planes are getting faster?), then south to Senegal and the Congo, east to Nairobi, north to Pakistan, and, finally, south again to Sydney before returning to New York via San Francisco (including a two-week vacation in wine country).
I wasn’t much more direct than Fogg, but I was definitely more comfortable. I had no confrontations with any Sioux people — but I did have to be aware of modern cannibals in Gabon; they’re still around.
Are we all on the same planet?
In this series of articles, we’re going to take a new around-the-world journey. Not to worry; you won’t need a passport or vaccination card. We’ll go around the world in writing, and you can read this at your leisure. The bets involve your portfolio. And our purpose could not be more serious.
Analysts and investors tend to go country-by-country in their reviews. They’ll write about inflation in the US, a slowdown in Germany, policy paralysis in Japan, and a coming collapse in China. All of those developments are important, and the best analysts do a great job with them. Investors can choose among the affected markets accordingly.
What’s missed are the connections among these trends and the bigger picture of the global economy. Even with globalisation in unwind mode, the world economy is still densely interconnected; no major economy operates in isolation.
If China’s economy is slowing, then Australia’s export sector is also suffering. If German manufacturing output is handicapped by energy shortages, then parts suppliers in Eastern Europe and Japan will see a slowdown in new orders. If the euro goes low enough against the dollar, then US consumers may see French wine at bargain prices to the disadvantage of California wine producers. This much is straightforward. Yet, the connections go even deeper.
If one central bank, such as the Fed, is raising rates, then a central bank such as the ECB may have to follow suit, even with a slowing economy, just to keep the euro from going below US$1.00 (referred to as parity).
If the Bank of Japan refuses to raise interest rates at all (which it is), then the yen will go into freefall against the US dollar (it has). That can fuel the yen carry trade (where investors borrow yen at low rates and pay back the loans with even cheaper yen after the devaluation), which leads to asset bubbles as the yen holders swap into dollars or euros to buy stocks or real estate.
Keep these connections in mind as we take our tour of the globe.
The worst of both worlds — high interest rates and high inflation
Manufacturing, mining, farming, transportation, retail, and services are key components of any real economy. Interest rates and exchange rates are like conveyor belts that move monetary stimulus or tightening from country to country.
Inflation and deflation metrics are like reading a thermometer applied to a sick patient — you can tell if something’s wrong. Inflation and deflation are warning signs that something’s amiss with your economic policies.
Those signs force policymakers to respond in certain ways to remedy the malfunction. The policy prescriptions often solve one problem (say, inflation) while causing another (say, recession). Understanding these interactions and feedback loops allows you to turn data into predictive analytic models.
The chart that follows is an excellent resource to see how major economies have used their policy tools in the past year to address their number one economic problem — inflation.
The chart shows a selection of major economies indicated by coloured dots. The y-axis shows inflation; the x-axis shows interest rates. The coloured dots show a country’s position in January 2022 and today.
[Editor’s note: The monthly edition this article was adapted from was published in early July 2022.]
The slope and length of the connecting lines give an idea of the rate and size of any change. The chart covers a six-month period, so any changes have happened very quickly:
|
|
| Source: Visual Capitalist.com |
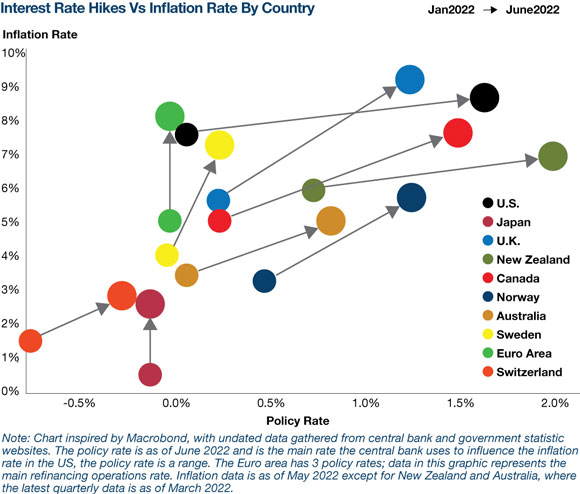
Every country (or economic group in the case of the Euro area) has experienced higher inflation. Every country, except Japan and the Euro area, has experienced higher interest rates. (The ECB will raise rates in the coming weeks. No rate increases are expected in Japan until late 2023 at the earliest.)
The movement from lower left to upper right (true in all cases except Japan and the Euro area) is the worst of both worlds: higher interest rates and higher inflation.
Canada and New Zealand are notable for steep climbs in interest rates. Switzerland, Sweden, and Norway are notable for steep climbs in inflation (the rate hikes won’t be far behind). The US and UK have experienced both.
The locomotive is dead
The main lesson of this graph is that the problem of higher inflation and the policy response of higher rates are a global phenomenon. They’re not confined to a small group of countries.
It’s not the case that any one country has the headroom to provide stimulus that can help the world without causing inflation at home. The locomotive theory — that one country can pull an entire train up a hill — is dead.
Of course, this graph only shows major developed economies (including eight of the 10 largest economies in the world). When we include other major economies such as India, Brazil, and Russia, the result doesn’t change. Inflation and higher interest rates are the norm.
The glaring exception is China, the world’s second-largest economy.
In China, the latest inflation rate shows a modest 2.1% increase (annualised). The most recent month-over-month inflation data shows a decline of 0.2%. Interest rates are a relatively low (3.7%), and the Peoples Bank of China (PBC) has been leaning toward monetary ease recently.
The most recent annualised GDP growth rate for China is 4.8%, quite low by Chinese standards. Most analysts believe that the actual growth rate is much lower, perhaps even 0.0% (the Chinese are notorious for lying about economic results in order to maintain a growth narrative).
The Chinese yuan (CNY) has been declining relative to the US dollar (USD). This may be a symptom of a classic currency wars strategy to cheapen your currency to promote exports and export-related jobs.
Is China an anomaly, or is it the canary in the coal mine? Is weak growth in China the shape of things to come in the rest of the global economy?
Keep an eye out next Wednesday for part two of this series of articles.
All the best,
 |
Jim Rickards,
Strategist, The Daily Reckoning Australia
This content was originally published by Jim Rickards’ Strategic Intelligence Australia, a financial advisory newsletter designed to help you protect your wealth and potentially profit from unseen world events. Learn more here.
