Stock markets are not looking right.
They have sold off over the past month after reaching all-time highs in early September.
The price of oil has surged further to over US$75 a barrel. Gas and uranium prices have also risen sharply.
Even central bankers are conceding that inflation will remain for longer. This is despite the US Federal Reserve saying just two or three months ago that it was temporary. They have backpedalled (oh, what a surprise!).
Cryptocurrencies failed to break past the highs achieved in May and the signals suggest that they could continue to fall.
Safe haven assets like gold and bonds are also selling off.
No sign of a flight to safety.
These signs suggest to me that October may be an ugly month.
You could see a lot of red splashed across the computer screen.
I might be wrong. It could just be a blip on the radar as investors climb over yet another wall of worry.
Let me explain my thinking by looking at the money markets and bond yields.
Reading market signals in bond yields
The US 10-year Treasury yield data is some of the most closely watched data in financial markets.
Bond yields can reflect the state of an economy.
A growing economy will see higher bond yields as investors would rather hold growth assets. Bond yields are lower in a weaker economy as investors increase their demand for a safe investment with more certain payments.
The way it works is investors typically allocate their portfolio between safe and risky assets depending on their expectations on the market outlook. So the prices of these assets in the market reflect investors’ preferences for safe and risky assets.
Now, a more meaningful yield that investors are interested in is the inflation-adjusted return on bonds. This is because prices can rise due to a combination of higher demand and inflation.
A growing economy is one where there is a healthy increase in productivity with a corresponding increase in the demand of goods and services. On the other hand, a weak economy is one plagued by lower productivity and an excess in demand for goods and services, causing inflation.
Knowing this difference allows you to read market conditions better, and therefore your decision-making puts you ahead of other people.
How to Survive Australia’s Biggest Recession in 90 Years. Download your free report and learn more.
Real and nominal long-term bond yields threaten market stability
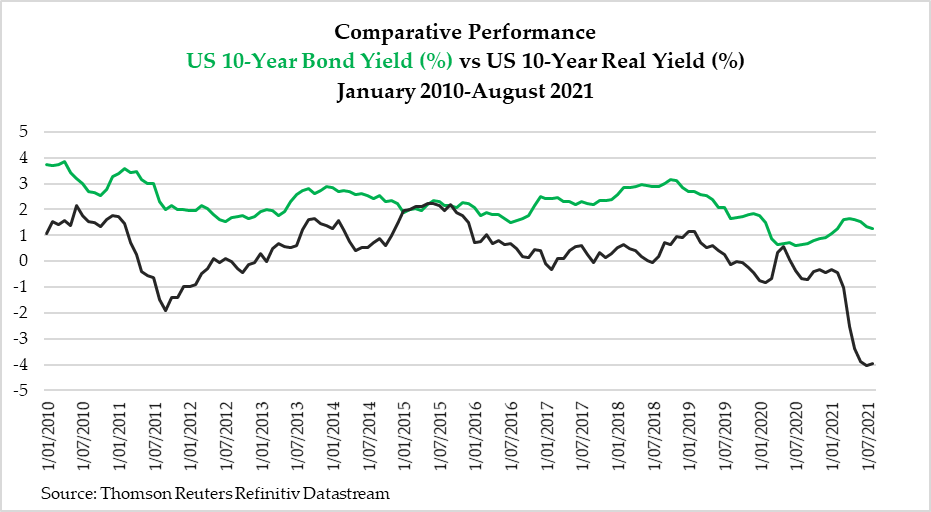
Let us look at the US 10-year nominal yield (in green) and also the real yield (in black):
|
|
| Source: Thomson Reuters Refinitiv Datastream |
The Federal Reserve cut the interest rate to almost 0% in March 2020 as the global economy began shutting down during the Wuhan virus outbreak.
This caused the nominal 10-year yield to hit its all-time lows in mid-2020. It has since recovered from 0.7% to 1.52% now. However, it is well below the levels seen in 2010–11 and 2017–19.
The rising yield would normally suggest that there is a recovery in the US economy and the rest of the world, as the world reopened gradually.
Not so fast.
Check the real yield.
That has fallen sharply since the start of the year.
The difference between the nominal and real yield is a result of inflation. And inflation has run rampant during the year.
Why is that?
Firstly, global lockdowns have severely damaged the supply chain around the world. Factories, mines, shipping lanes, construction sites, etc are not like light bulbs that can just switch on and off. Even an oven takes minutes to heat up.
Secondly, the US has reduced their supply of oil domestically and internationally, as the Biden administration’s policies move towards eliminating reliance on fossil fuels. This caused the rising price of oil and this causes higher inflation rates.
Thirdly, many nations are following the protocols set by the World Economic Forum to embrace clean energy and reduce carbon emissions. This has led to reduced productivity because fossil fuels offer a cheap energy source.
The way things are heading, I believe inflation will remain for a while yet. Remember, the governors of the Federal Reserve have backpedalled, they have blown it.
What are the implications of a slowly rising nominal bond yield and rising inflation?
Yawning valuation gap between equities and gold
A rising bond yield means rising borrowing costs. Coupled with an economy with high inflation, this is a bad combination.
Why is that?
An economy can grow on more debt as long as it results in productivity. Higher productivity leads to general deflation in the economy. There are more goods and services than fiat currency, so you pay less for consumption.
We are certainly not seeing this with such high levels of inflation.
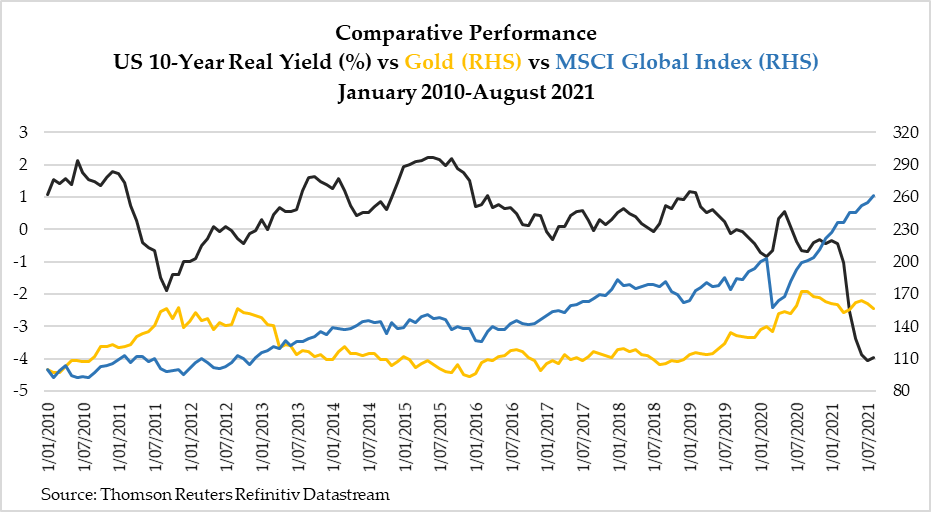
However, it seems that some investors get the hint, but many do not. Check this figure below where I compare the returns on gold and the global equity markets, using the Morgan Stanley Capital Index. This is based on data up until last August:
|
|
| Source: Thomson Reuters Refinitiv Datastream |
Risky assets like equities and properties can hedge against inflation.
So can gold. In fact, many consider using the 10-year real yield as a good indicator for how gold will perform as they move in the opposite direction.
However, look at that chart carefully. It seems like the real yield curve and gold are turning around.
Could we see higher bond yields and inflation lingering?
That could explain why gold is not catching a bid, and why global stock markets have been jittery for the past month.
Everyone knows that no one rings the bell at the top of the market. And often the smart investors leave the party early and don’t overstay their welcome.
I reckon the signals are quite clear. Make sure you are not caught out!
God bless,
 |
Brian Chu,
Editor, The Daily Reckoning Australia
PS: Our publication The Daily Reckoning is a fantastic place to start your investment journey. We talk about the big trends driving the most innovative stocks on the ASX. Learn all about it here.


