You can’t analyse the 18.6-year cycle using short-term data. Yet most real estate indexes only go back a few decades to the time when transactions started to be recorded digitally.
Some analysts have delved through historical archives to laboriously extract a longer series of data for various regional areas.
However, the one thing I want to tell you about today are the charts spanning 350 years of housing data.
That makes it an extremely valuable document for several reasons.
Few know of its existence, let alone its significance to the study of the 18.6-year land cycle.
It was put together by real estate finance professor Piet Eichholtz of Maastricht University.
Eichholtz was frustrated by papers that made assumptions on housing cycles with short-term data.
The problem is, most short-term indexes conclude that values in prime city regions go up significantly over time — the longer you hold, the better!
Who hasn’t heard real estate agents say, ‘It’s time in the market, not timing the market that counts.’
Eichholtz set out to prove the opposite in a 2006 New York Times interview:
‘If you look at most research on real-estate markets, papers will typically say they are taking ‘a long-run look and then they go back 20 years.
‘I wasn’t impressed with that.
‘I thought you had to go back further to get a really good picture of what a housing market performs like.’
The index compiled is called the Herengracht Index.
It follows the change in real estate values along a *prime strip* of the Herengracht Canal in Amsterdam.
What’s so special about the Herengracht Canal?
The Herengracht Canal is considered the most important canal in Amsterdam.
An address on the Herengracht is seen as a prestigious statement of wealth. It’s home to the city’s mayor, bankers, lawyers, and celebrities.
In the 17th century, the richest merchants lived along the canal.
The houses date back to the 1600s — an era when Amsterdam was the financial kingpin of the world.
To give some context’ before this, wooden homes were the norm.
However, almost all were wiped out by three major fires. This led to a ban on wood being used for construction, and from the 1600s onwards, only brick and stone houses were permitted.
Napoleon and Hitler both had their turn conquering Amsterdam over the centuries. However, due to the building materials and quality of construction, the homes endured throughout.
|
|
|
Source: Lorena CirsteaPhotography |
It’s one of the reasons that the Herengracht Index is considered unique.
Modern indices are required to adjust for changes in housing stock.
For example, as extensions are added or as properties are upgraded and replaced — this needs to be accounted for.
Keeping an accurate record of median changes in the locational value of land, therefore, is challenging — it can easily be skewed.
This is a big issue in Australia.
It’s one reason you can never trust median rises in house prices to record accurate changes in values.
To do so, they need to be based on a high volume of very comparable sales eliminating new and extended builds.
The Herengracht Index, on the other hand, shows a series of repeat sales figures for a small significant strip of real estate that has seen minimal changes over the centuries.
High-density terrace housing with very little room to extend or add to the interior space.
Yet it’s a strip of land that has always attracted speculative capital.
The benefit is that it only closely records the locational change of value!
In other words, constant quality real estate ‘flips’.
The other important point is that this index has been adjusted for inflation.
It corrects for rising consumer prices (but not wages.)
It shows *real* house prices rather than nominal ones.
This, to some extent, proves the point Eichholtz intended.
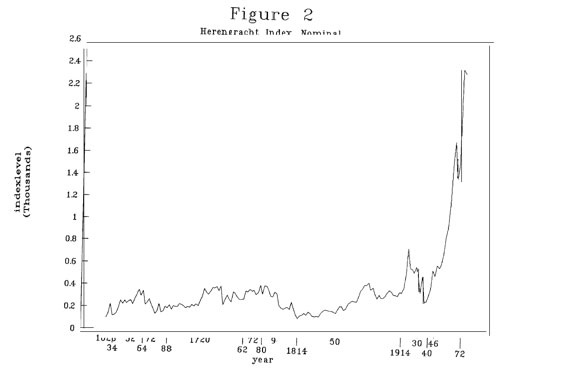
Over a 345-year period, in nominal terms, housing values increased ‘more than tenfold.’
A bi-annual increase of 11.6% for the period.
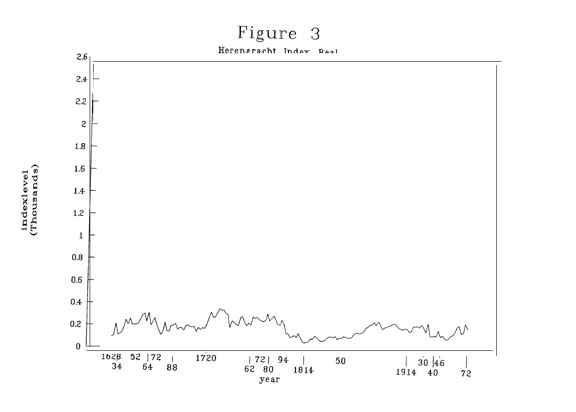
In real terms, however, the increase from the first to last sale is largely insignificant. The inflation-adjusted cost of housing only increased by 3.2% — leaving the real value broadly the same.
You can see this demonstrated in Eichholtz’s charts below (Figure 2 Nominal changes in housing values, Figure 3 Real changes):
|
|
|
|
|
Source: A Long Run House Price Index: The Herengracht Index, 1628–1973 |
Eichholtz’s warning for all real estate speculators
The key for the owners along the canal was knowing the cycle well enough to time both the purchase and the sale.
Those that did made a windfall.
Those that didn’t lost everything.
For our purposes, it underlines the importance of ‘timing the market’ rather than ‘time in the market!’
The Herengracht Index starts in the very early 1600s.
Eichholtz extended the data to 1973.
Others have updated it to 2020.
That’s impressive.
More than 390 years of data.
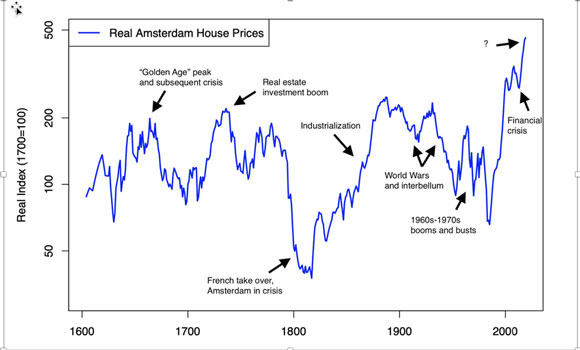
Below is a version of the index updated to 2020 that highlights some of the major events affecting the region.
|
|
|
Source: Herengracht Index updated by Matthijs Korevaar |
Here are a couple of points to take from the updated chart.
Real prices in 2020 were more than 100% higher than during previous highs (1664, 1736, and 1900), with 6% year-on-year price growth since 1985.
A feature of modern monetary and lending policies that leads to bigger booms and, potentially, bigger busts.
But if we take a closer look at the booms and busts on this index and test them against the 18.6-year real estate cycle — there is a clear correlation.
Charting the 18.6-year cycle on the Herengracht Index
The start of the index covers a time historically remembered as the ‘tulip bubble’.
The truth is, however, it had far more to do with land than tulips, and real estate flips sat behind the funding.
Residents flipped their houses at ‘ruinously low prices’ to raise funds to invest in tulip bulbs.
Tulips sold for approximately 10,000 guilders. Equal to the value of a mansion along the Grand Canal!
In the five-year period between 1628 and 1633, inflation-adjusted prices of houses on the Herengracht doubled.
After the crash in 1637, land prices plummeted to the same level the index started in real terms and more than 50% in nominal terms.
Real estate speculators made a fortune and lost a fortune.
Let’s take this date, 1637, the first recorded bust on the index, and see how it pans out over the centuries, in line with the 18.6-year cycle.
I’ve used the historical date of the bust to test the data because the exact real estate peak of any regional market can vary depending on local events.
In other words, 14 years up and four years down in land values is just an approximation.
The peak for real estate values historically can push into 16 years — or fall short and ‘soften’ prior to a collapse.
Simply, the real estate market is not as reactionary as equity markets.
However, the economic recession at the end of the 18.6-year cycle will always occur close to a sharp downturn in real estate values.
This is what we’re going to test on the index.
Here are the dates I’m going to highlight on the Herengracht chart.
- 1637 + 18.6 (and so on)
- 1655
- 1674
- 1692
- 1711
- 1729
- 1748
- 1766
- 1785
- 1804
- 1822
- 1841
- 1859
- 1878
- 1897
- 1915
- 1934
- 1952
- 1971
- 1990
- 2008
- 2027
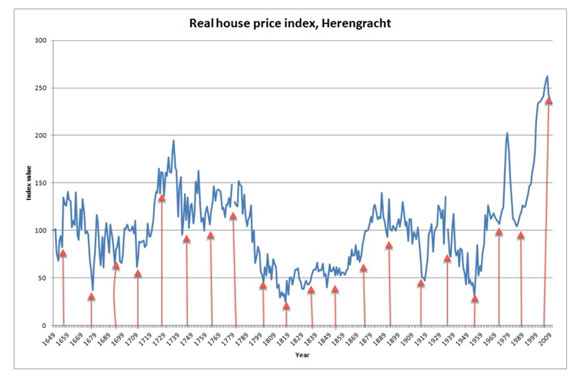
I’ve plotted the dates on the index showing that they fall at, or close to (i.e., a year either way), a sharp downturn in the Herengracht Canal’s real estate values.
I’ve used a version of the index that culminates in 2008 simply because it makes it a little easier to pick the dates along the ‘Y’ axes.
Here’s the result:
|
|
|
Source: The Eumaeus Project (edited Catherine Cashmore) |
As you can see, for the most part, these plotted dates coincide with significant downturns in real estate values along the canal.
Local events had an impact, either reducing or inflating the gains made.
Recessions, plague, and war all interrupted the cycle, so to speak.
However, the sharp downturns in real estate values at the end of the cycle are clear.
What of today?
The index demonstrates that, until recent times, the mansions along the canal lost all their accumulated value in each downturn (and sometimes more).
With little option to ‘add value’, owners rode the full volatility of the cycle based on locational values alone.
Keep this in mind when investing with knowledge of the cycle.
It’s one reason I always advise my clients to have land they can subdivide at the base of their property portfolio (with a rentable house on top that you can add value to).
The value of subdividable sites is not based upon locational value alone but also on the zoning and overlays which dictate what you can construct.
We’re into the final few years of the cycle.
If you know the timing, you can play the game.
The next few years are going to prove very lucrative for those that have the knowledge to make quality real estate investments.
If you want the secrets that will enable you to take advantage of this cycle in both the property market and stock market, consider signing up for Cycles, Trends & Forecasts today.
Best Wishes,
 |
Catherine Cashmore,
Editor, Land Cycle Investor


