
Did you happen to see this quote from The New York Times on 10 February?
‘Much of the recent rally was powered by once-wary investors, who avoided stocks at the end of last year, jumping back in the market this year…investors seem more willing to take on risk when they have a whole year ahead to recover from setback.’
Oh, I forgot to put the year.
The New York Times extract is from 10 February…2001.
It’s only natural that habits, formed by speculative manias (like the dot-com boom), create reflex reactions.
Buy-The-Dip. The worst is over. The year ahead will be better. Recovery is at hand.
There are times when impulsive responses work and there are times when they don’t…
|
|
| Source: Macro Trends |
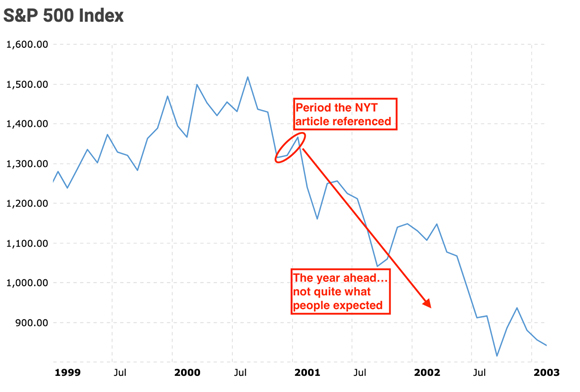
And the reason why the year ahead got worse (not better) is pretty straightforward.
Earnings disappointment.
After the share market peak in 2000, S&P 500 earnings fell BELOW the regressed EPS (Earnings Per Share) trend…dropping from around US$50 to almost US$20…
|
|
| Source: Crestmont Research |

In the early stages of a bear market, the math begins to change.
Earnings start to disappoint. Profit margins begin to get squeezed.
And another often overlooked (but extremely important) dynamic is also undergoing change.
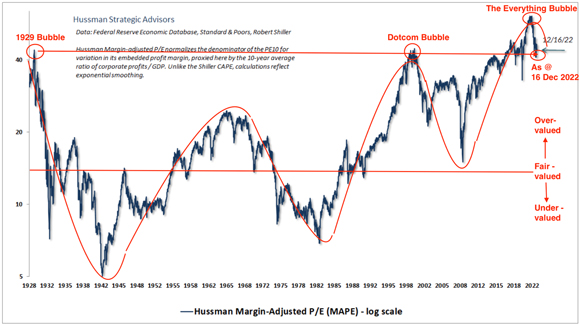
The multiple (Price/Earnings ratio) applied to shrinking earnings…it too is retreating to a lower number.
From its dot-com bubble high of 40 times, the Margin-Adjusted P/E (MAPE) shrank to 20 times.
|
|
| Source: Hussman Strategic Advisors |
The math is very simple.
Earnings of $10 times P/E of 40 equals $400
whereas
Earnings of $8 times P/E of 20 equals $160
Change the earnings and multiple inputs and you get a HUGE price difference…a fall of 60%.
While the cold hard numbers, that ultimately determine price, are undergoing change, the emotional drivers are much slower to adjust.
In the early stage, investors are still living in yesterday’s market…a time when any financial troubles seemed so far away.
This is why, when tomorrow’s market arrives, it comes with such a shock…with troubles few are expecting.
What happens when expectations are not met?
In what’s shaping up to be a repeat of 2001, the next phase down in this bear market is ‘decreased business and earnings’.
The reality is, Q2 (1 April–30 June 2023) earnings were down, but, in typical analyst style of ‘tomorrow being better than yesterday’, earnings are expected to surge higher later this year.
|
|
| Source: Reuters |
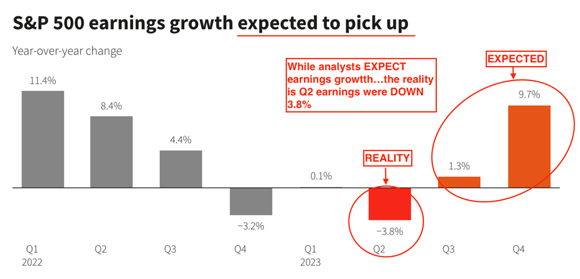
Hope springs eternal this negative earnings season is going to be the exception, not the rule.
Based on the bursting of bubbles past, I’m not so sure about that.
In the recessions caused by the last two bubbles bursting — dot-com and US housing — there was a marked difference between MONTHS of economic contraction and QUARTERS of EPS decline.
|
|
| Source: DA Davidson |
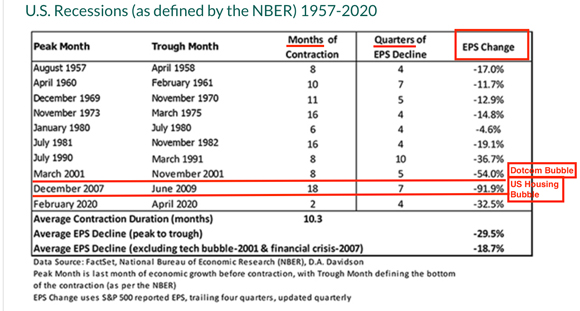
In 2001, the recession lasted eight months, while earnings declined 54% over a 15-month (five quarters) period.
The Global Financial Crisis lasted 18 months and earnings declined by 92% over a 21-month (seven-quarters) period.
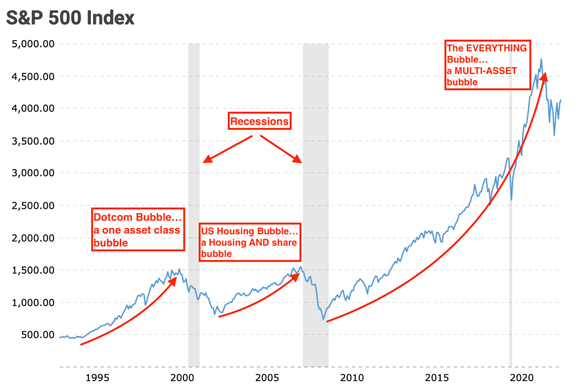
So, what fate awaits the greatest asset bubble in history…the now infamous ‘everything bubble’?
In attempting to answer this question, we first need to make an educated guess on why the Global Financial Crisis recession was far worse than the one following the dot-com bubble.
If we look at the S&P 500, the rise from 1995–2000 (dot-com bubble) was actually greater than that of the 2002–07 (US housing bubble) period.
Both bubbles busted back to around the same 700–800 point level.
|
|
| Source: Macro Trends |
At first glance, you’d conclude the dot-com bubble being a little stronger on the upside, would produce more pain.
But that’s not what happened.
The duration (and, financial and emotional pain) of the Global Financial Crisis was far greater than the recession AFTER the dot-com bubble.
This is going to be much worse than the global financial crisis
My theory is this…
The dot-com bubble was a ONE asset class bubble. Predominantly tech shares. When it busted, it hurt. But most of the pain was contained in the Nasdaq.
The US housing bubble was a TWO asset-class bubble. Housing and financial stocks. The pain from this bust was more widespread. A greater number of households were impacted by the loss of wealth effect. Consumers retreated.
Which brings us to the question of ‘what fate awaits the everything bubble?’
How many asset classes are involved in this bubble? Off the top of my head, we have…shares, listed AND unlisted property, bonds, SPACs, private equity, venture capital, cryptos…you get the picture.
This monster bubble covers almost everything and everybody. From day trading meme stocks to UK pension funds to industry super funds.
Most asset classes were floated higher by a sea of liquidity and low-interest rates. Now, the liquidity is being drained and interest rates are much higher.
In further support of my theory, there’s the US Federal Reserve’s own data on the long-term dynamic between US Household Net Worth to Disposable Personal Income.
|
|
| Source: FRED |
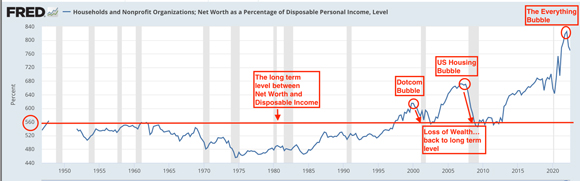
On average, most households have a level of wealth that’s reflective of their income.
When you balance out the unders and overs, the long-term level between net worth and disposable income settles under around 560%. Imbalances — periods above and below the long-term level — are invariably corrected by market forces.
The suppression of household wealth caused by the inflationary 1970s began to reverse in the mid-1980s when interest rates fell, shares were once more in favour and property values recovered.
Conversely, market forces go to work when things get out of kilter on the upside.
The dot-com and US housing bubbles temporarily inflated US household net worth. Share portfolios compounded to higher levels. Property values soared.
For a fleeting moment in time, people were chuffed with the numbers on their personal balance sheets. But the figures weren’t real.
On each occasion, recessions, as if guided by a magical hand, returned household wealth to the level of natural balance…around 560%
The Fed’s own statistics confirm the loss of wealth effect after the US housing bubble busted was much greater than it was from the dot-com bubble implosion.
More people losing more money intensifies the negative forces on the economy. Not a particularly difficult concept to grasp…at least that’s my theory.
Now, cast your eyes upwards and to the right…look at the level of artificial wealth created by the latest and greatest multi-asset bubble.
The everything bubble is the mountain to the US housing bubble’s molehill. That little downturn in the blue line, is an indication market forces have begun to correct this extraordinary imbalance. If recent experiences are any guide, there’s a long way to go before the market’s job is done.
Despite the previous bubble-bursting precedents, we’re told ‘it’ll be a soft landing’.
Really? Personally, I seriously struggle with that. For now, this is the narrative (enough) people are choosing to believe. No one is seriously considering the impact a loss of wealth on this scale will have, not just on the US economy, but globally.
However, as we know from bubbles past, mindsets can and do change…and quickly.
When tomorrow suddenly becomes today, household finances are going to be in trouble.
Until next week.
Regards,
 |
Vern Gowdie,
Editor, The Daily Reckoning Australia
