

There’s a lot of opinions about markets and stocks, but hidden behind all of that are vested interests and strong biases.
That’s why I like using price action, known as technical analysis. We get this information from the company’s price charts.
Charts are a commodity trader’s best friend. I use them regularly, alongside my knowledge of geology and the mining industry.
From what I’ve found, if you can read the ‘tape,’ it can sometimes offer insights equivalent to an entire team of analysts relying solely on fundamental analysis.
Over the coming weeks, I’ll share examples of using charts in my investing. I’ll do that with real-time examples.
So, let’s start with a bit of taste of that today by trying to answer this critical question:
When will this relentless gold bull market
hit resistance?
If you look at the financial news, the best they can come up with is big round numbers like $5,000 per ounce. In other words, useless predictions.
So, how can we come up with something better?
Well, gold has already broken into new all-time highs.
Any prior resistance levels are no longer relevant; gold is running uncharted territory.
And that can leave traders and investors blind as to where gold might hit selling pressure next.
So, this is what I do…
Find a chart of a major gold miner that hasn’t broken into new highs and determine where it is likely to meet resistance.
To show you what I mean:
One of the world’s largest gold mining companies is a North American stock called Newmont [NYSE: NEM].
Like most gold producers, Newmont has soared over the last 12 months as profit margins fatten due to stronger gold prices.
But that’s in the past, I’m interested in understanding how Newmont’s price action could offer clues for the broader gold market.
Newmont is a useful stock to examine because it’s one of the biggest producers in the sector. Perhaps more importantly, it has not broken into new all-time highs.
As you can see below, its major high occurred back in April 2022, red square to the left:
| |
| Source: TradingView |
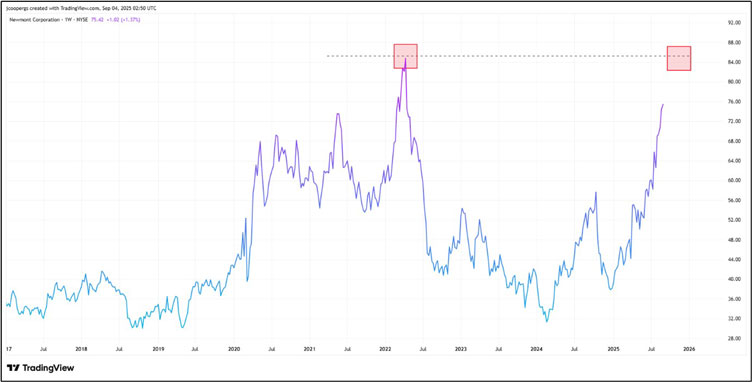
However, with the current rally in the gold market, Newmont is fast approaching this 2022 top.
That’s where I think you should monitor for a potential reversal in this gold run-up.
The probability that Newmont faces selling pressure here is high, which will offer an important signal for the broader gold market.
There’s no way of knowing how significant it will be, but it is a danger zone.
As of writing, Newmont is about 12% away from making this critical double-top.
I suggest watching it carefully over the coming weeks. Once this level is reached, we’ll revisit it (again) and unpack what happened.
Until next time.
Regards,

James Cooper,
Mining: Phase One and Diggers and Drillers

Comments