
Oil is trading ~28% below silver right now.
Let that sink in.
A barrel of crude costs less than a single ounce of shiny stuff.
We’ve only seen this twice in the past 70 years. Both times, oil came roaring back while silver gave up its gains.
The chart below shows our current moment.
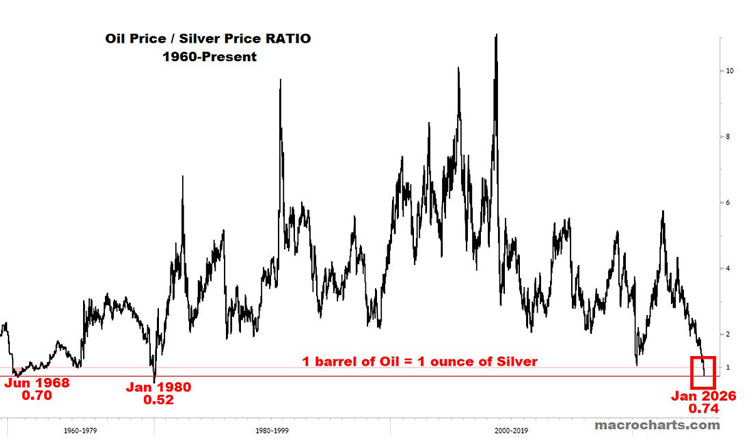
Source: Macro Charts
[Click to open in a new window]
Oil is now trading below silver for only the third time in seven decades. This isn’t normal. History suggests it doesn’t stay this way.
In 1968–1970, oil traded below silver. Silver bottomed in 1971 while oil gradually rose. Oil significantly outperformed.
Fast forward to 1980.
Oil briefly traded below silver again. Over the next three years, oil rose 35% while silver gave back a year of gains. Oil significantly outperformed.
Most recent? 2020.
Oil traded just 5% above silver at the pandemic depths. Silver doubled from May to August 2020, then round-tripped the entire rally by late 2022. Oil won again.
The pattern is clear. When oil trades this cheap relative to silver, oil has form winning the next leg.
Now bear in mind that these examples are impacted by war and pestilence.
Hopefully neither plays out this year in 2026.
For context…silver is at US$83 per ounce, up more than ~180% in a year.
Still – that’s a bit too hot for my taste in precious metals.
But well done to any silver bug that was able to stick with the trade for the last few years.
What about gold?
Gold’s telling a different story.
I remain confident gold will do very well in the second half of this year.
Unlike silver’s more speculative fever, gold’s rally has been supported by central bank buying and real monetary debasement concerns.
The big investment banks agree, with Goldman Sachs and JP Morgan both backing a gold price in the range of US$5K by year’s end.
So this isn’t a particularly ‘out there’ call on my part.
But I think given historical precedent, silver’s run should cool somewhat.
And that could see speculative fervour turn to a different part of the market.
Where does that leave us?
Energy, energy, energy.
Venezuela is a founding OPEC member sitting on 303 billion barrels of proven oil reserves.
That’s ~17% of the global total and more than Saudi Arabia’s 267 billion.
Yet the country pumped just 934,000 barrels per day in November compared to the 3 million barrels in the late 1990s.
If US oil companies invest billions to repair Venezuela’s damaged infrastructure, we could see meaningful production increases within a few years.
That should eventually add downward pressure on global oil prices.
But as we know, large energy projects take a long time to reach the market.
Speaking of long-brewing energy bottlenecks…
Here’s where it gets
interesting for Australia
I’ve been banging this drum for a few months now, but it’s well documented that Australia faces a looming east coast gas crisis.
The ACCC has repeatedly warned of deteriorating supply.
Queensland should be fine, but southern states will collectively need an additional 26 petajoules through Q2 2026.
Victoria’s Iona storage facility needs about 12 petajoules of injections before May 2026 to replenish ahead of winter. Gas prices have rocketed from $5 per gigajoule to $12–14 today.
Australia is already the world’s largest LNG exporter.
When the demand in the APAC region collides with a domestic shortage that can only be addressed with new projects, the results could be explosive.
I know it sounds odd, but what if the silver speculators finally get a taste for QLD gas developers?
Stranger things have happened in markets.
Much stranger.
I know there are a solid handful of Queensland gas developers out there trading at steep discounts, which could benefit in this environment if the east coast shortage intensifies.
Tomorrow, I’ll take a closer look at Australia’s energy conundrum and how that plays into specific stocks.
Best Wishes,

Lachlann Tierney,
Australian Small-Cap Investigator and Fat Tail Microcaps
***
Murray’s Chart of the Day – Aluminium
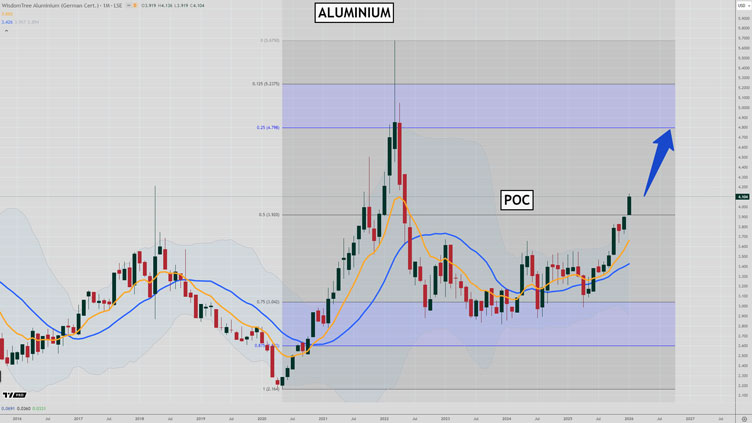
Source: TradingView
As gold and silver continue to shoot higher, other commodities are starting to join in the fun.
After a couple of years in the wilderness aluminium has broken out of its range and is starting to trend higher.
You can see in the chart above that there was a huge rally from 2020 to 2022 that was snuffed out over the last few years.
The price of aluminium dropped into the buy zone of the previous rally and then spent the next couple of years tracing out a rounding bottom.
The long term trend turned up in mid-2024. But it is only in the last few months that we have seen the price bust above the top of the range it has been stuck in.
Also notice that the price has also broken through the midpoint of the range traced out by the 2020-2022 rally (POC).
That is bullish, giving targets to the sell zone of the range which is 17% above current levels.
Regards,

Murray Dawes,
Retirement Trader, International Stock Trader and
Murray’s Trading Room

Comments