



Tonight could be an interesting one to watch.
As those of us in Australia head to bed, the US will release a barrage of economic data.
First-quarter GDP revisions. Jobless claims. Building permits. Personal spending. Lots of barometers are due as we check in on the health of the US economy.
Including the one that matters most to markets right now, April’s PCE Price Index. That’s the Federal Reserve’s preferred inflation gauge.
Well, it is for now.
The newly installed Fed Chair, Kevin Warsh, has suggested changing the way inflation is measured at the institution.
His proposed changes to a ‘trimmed mean’ inflation figure would strip out the most extreme price moves.
That puts inflation back to around 2.4%. Convenient at a time when fuel and food prices spike, but your boss wants you to cut rates.
If he gets his way, the goalposts of the Fed’s 2% inflation mandate shift, and he has a green light for cuts.
At a time when the Iran conflict continues to pressure energy prices.
Tonight, Wall Street is expecting a higher PCE, but if that number lands hot, it will effectively kill what little remains of rate-cut expectations for 2026.
This all arrives at a moment when the market’s biggest driver looks overextended.
The AI Semi’s Trade Looks Stretched.
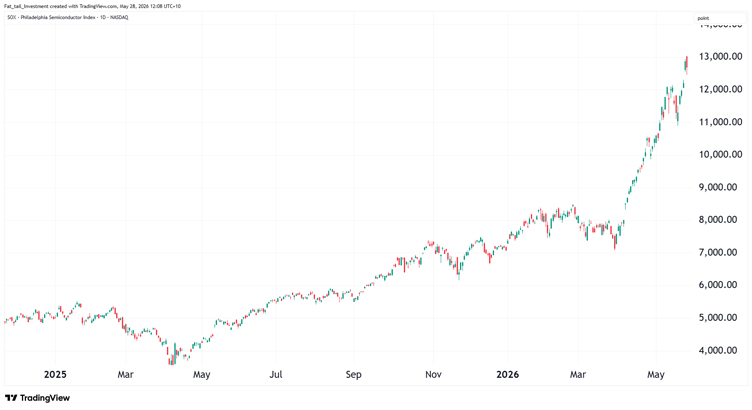
Semiconductor stocks have been the engine of this most recent rally.
The SOX index has nearly tripled from its 52-week low, as Nvidia again posted record quarterly revenue. This time, topping US$81.6 billion.
Source: TradingView
[Click to open in a new window]
The AI infrastructure buildout is real, and the numbers are staggering.
But stretched is stretched. Earlier this month, the SOX fell sharply after a hotter-than-expected CPI print sent chip stocks tumbling. We could see that again in the short-term.
Multiple analysts I read have flagged the sector as showing signs of upside exhaustion, with semiconductor stocks losing relative strength against the broader index.
None of this means the AI trade is over. It just means this leg of the run looks tired.
When the best-performing sector in the market is priced for perfection, any disappointment, from inflation data, geopolitics, or earnings guidance, gets punished hard.
And right on cue, geopolitics has obliged.
Fresh Strikes, Fragile Talks
Overnight, US forces struck an Iranian military facility near the Strait of Hormuz after downing four attack drones.
It’s the second set of strikes in three days, despite the ceasefire ostensibly holding between Washington and Tehran.
Trump vacillates between insisting a deal is close and calling Iran’s terms totally unacceptable.
Last night, he said Iran was ‘negotiating on fumes, ’ his usual Art of the Deal rhetoric, which says little about how close we are to a deal, which is far by my estimation.
For markets, the immediate concern is the Strait of Hormuz and the roughly 20% of the world’s oil that once freely flowed through it.
Further escalation could again send energy and downstream prices higher. Feeding directly into the inflation data that the Fed watches.
It’s a feedback loop: conflict drives oil, oil drives inflation, inflation kills rate cuts, and rate-cut expectations drive the valuations of the very tech stocks that have been carrying this market.
Put those threads together, and things look precarious for the US market.
A stretched semiconductor sector, stubborn inflation, and an unpredictable war are all converging at once.
Volatility is not a risk on the horizon. It’s the operating environment.
Finding Signal in the Noise
So how do you navigate it?
The temptation in markets like these is to either freeze or chase headlines.
Both can leave your capital stranded in the wrong sectors. Capital rotations are where you need to be looking — where money is heading next.
What matters is having a systematic way to cut through the noise and identify where genuine opportunity sits beneath the surface churn.
That’s exactly what I’ve been building for the past 12 months.
It’s called ATLAS, and it’s why I can tell you with confidence that — despite all of the above — there are pockets of real opportunity on the ASX right now.
ATLAS scans every small- to mid-cap ASX stock, scores them across multiple dimensions, and distils everything into a single number: the ATLAS Star Rating, from 1 to 100. The higher the number, the stronger the setup.
In volatile markets, most investors are flying blind.
They’re reacting to headlines, second-guessing their positions, and making decisions based on emotion rather than evidence.
ATLAS cuts through that. It doesn’t care about the news cycle. It cares about price action, momentum, and the structural factors that actually move stocks.
The kind of market we’re in right now, choppy, headline-driven, and rotational, is precisely where a tool like this earns its keep.
If you want to see how it works, register for the demo here.
Regards,

Charlie Ormond,
ATLAS and Altucher’s Investment Network Australia




Comments