
Three things you need to know today…
1) Readers of my service Australian Small Cap Investigator are reaping a rich harvest right now. Even better, there could be more to come!
Considering the swan dive in the ASX over the last few weeks, the news I keep delivering readers of my paid advisory just keeps getting better.
We’re on a hot streak.
Last month one of our positions skyrocketed 40% in about four days after a market update.
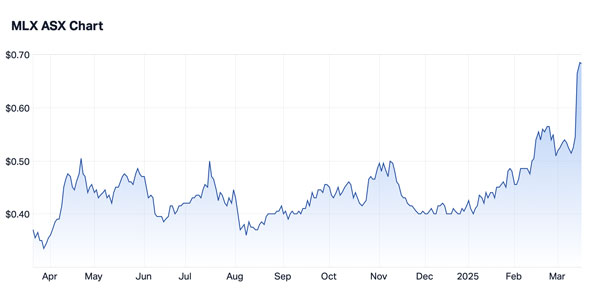
I told you yesterday about our tin miner Metals X [ASX:MLX]. It went up again on Monday. It’s now up about 30% in two trading days.
How exactly can it get better for my paid readers?
One of our gold positions — developer Spartan Resources [ASX:SPR] — is merging with Ramelius Resources [ASX:RMS].
The Street Talk column in The Australian Financial Review presaged this over the weekend.
I recommended Spartan in May last year. It had about a $600 million market cap at the time that issue went out.
It’s up 150% to over $2 billion now.
Look for yourself…
| |
| Source: Yahoo! |

A deal like this was on the cards for some time. Ramelius took a 19% strategic stake in Spartan last year.
We snuck in just before RMS made their move.
Back in December, I wrote to my readers…
‘On Monday, Spartan released more drilling results to the market.
‘The “Pepper” target at Dalgaranga (Spartan’s project) was an unknown quantity when I sent you the initial report in May.
‘Now it’s pushed SPR’s group resource base to over 2 million ounces.
‘That should make SPR a target to a bigger player.
‘We know Ramelius Resources [ASX:RMS] is already on the books here. RMS seems the most likely to make a move…
‘That gets back to the strategy behind our gold juniors, SPR and BTR.
‘Both are getting fattened up like a Turkey before Christmas lunch.
‘Odds on one, or both, are bought out in this gold cycle.’
And while I don’t always get it right, as you can see, the setup was there.
One down, one to go for us at Australian Small-Cap Investigator.
However, my colleague Brian Chu has a basket of suggestions for the coming gold M&A surge. You can see his latest presentation here.
Spartan is unlikely to be the last gold takeover target.
2) Markets bounced yesterday. Bull trap?
We had a whole lot of green across the market yesterday…and more today.
My colleague Murray Dawes suggested this outcome in our Closing Bell podcast last Friday. The market loves to get traders all going one way and then reverse on them. It’s part of what makes trading hard.
But is it just a bull trap?
Personally, I see volatility like we’ve had over the last few weeks as beneficial…if you know your stocks. You can scoop them up under pressure…and position for a bounce.
We gave you one idea last week from my colleague Greg Canavan: GQG Partners [ASX:GQG].
GQG has since stabilised alongside the general market. If you bring up a chart of the stock, you’ll see it made a recent low around $2.06.
If the market continues to rally, I wouldn’t want to see GQG fall below $2. That would be a red flag.
As it is, now we can see if it can push back up.
In other words, recent volatility like we’ve seen gives you a chance to ride a bounce and with some excellent reference points for placing a stop loss.
3) My colleague, geologist and mining analyst, James Cooper, keeps making the same vital, potentially very profitable, point.
Mining exploration has fallen off a cliff over the last decade. The supply issues coming to bite the world look like they’re going to be big in the years ahead.
As I showed you yesterday, one mine was knocked out of global tin supply and the metal has surged. This has sent Aussie tin miner MLX vertical…as you can see here…
| |
| Source: Market Index |
James has put down four stocks with similar potential. Make sure you’re following him!
Best wishes,
 |
Callum Newman,
Editor, Small-Cap Systems and Australian Small-Cap Investigator
***
Murray’s Chart of the Day — S&P500 vs key sectors
| |
| Source: Tradingview.com |
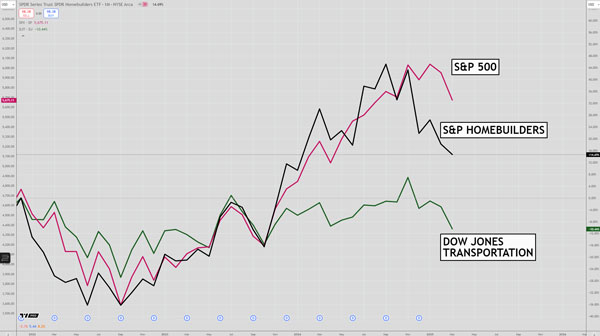
When markets correct sharply the question is always asked, ‘was that it?’
To get a feeling for the state of play out there I have put together a chart comparing the Dow Jones Transportation Average [NYSE:DJT], and S&P Homebuilders ETF [AMEX:XHB] to the S&P 500.
The chart shows the price action in each index since the peak in the markets in 2021.
Dow theory is a theory of market behaviour based on a series of articles written by the founder and first editor of the Wall St Journal, Charles Dow, many years ago.
One of the cornerstones of Dow theory is that a trend in the markets should be confirmed by the transportation index, and if they diverge it could be a sign of trouble.
Those ideas may not be as relevant today, now that manufacturing isn’t the lifeblood of the US economy anymore.
But it is still interesting to note that the transportation average didn’t participate in the rally of the last year, and the homebuilders index has been selling off for six months — effectively leading to the current weakness in the overall market.
So stocks may be bouncing for now and a short squeeze can often last one to three months. But there are some ominous signs beneath the surface of the market that we may end up seeing another leg down in markets at some point over the next few months.
Regards,
 |
Murray Dawes,
Editor, Retirement Trader and Fat Tail Microcaps

Comments