
“Brave, brave, brave, brave Sir Robbin…”
There are some classic scenes in Monty Python, and you’d be very brave to be buying at the moment.
But not quite foolhardy.
Let me take you on an epic quest for the holy grail/“Santa Rally” in a series of charts.
Take a look at this chart snippet from the bright folk over at Macro Charts:
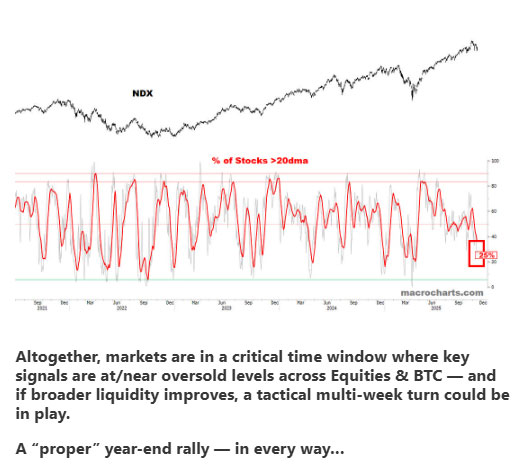
Source: Macro Charts
That’s the NASDAQ 100 Index [NDX] with its typical bottom left to top right movement in the top pane of the chart.
At the bottom pane, is the % of stocks that are above their 20 day moving averages.
As you can see, there are very few NDX stocks (generally growth/risk/tech) out there that are faring well relative to their moving averages.
Just 25%, in fact.
Macro Charts reckon a proper year-end rally could play out IF broader liquidity (see link for a definition) improves.
So what’s happening on that front?
Just a small easing on the chart (circled in green):
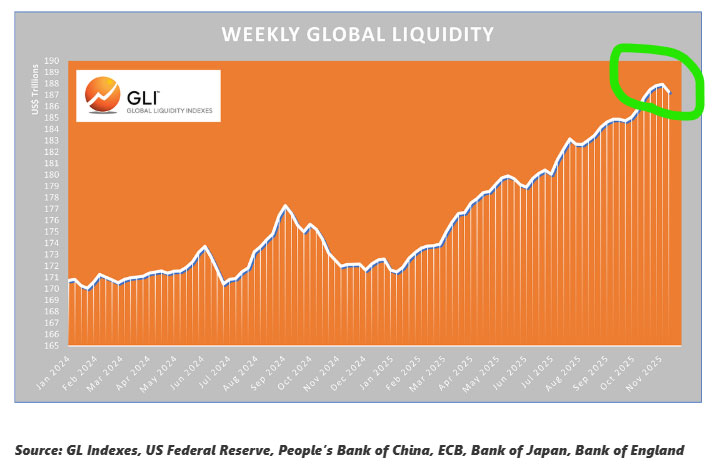
Source: Capital Wars
China is propping up liquidity – note the Reserve Requirement Ratio has fallen consistently for nearly four years:
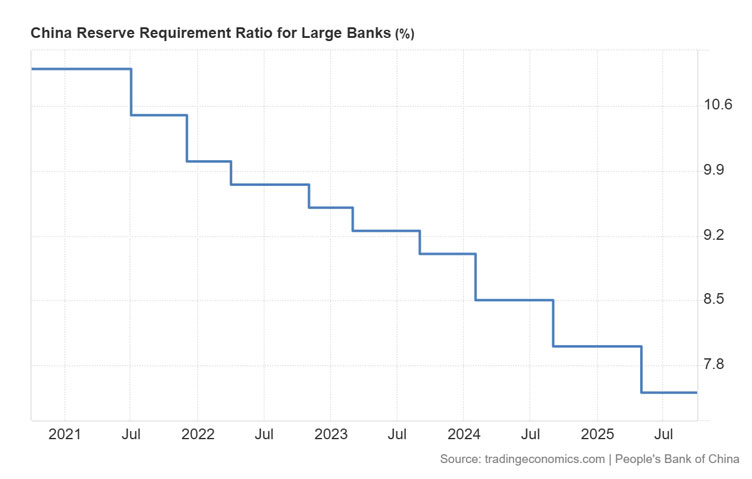
Source: Trading Economics
I put that down to demographics, an ailing construction-banking complex and the squeeze put on them by Trump.
But what’s holding global liquidity back?
Well the boffins at Capital Wars pointed to “Fed liquidity tightening (continued tightening despite recent FOMC statement signalling the end of QT)”
QT is “quantitative tightening, a contractionary monetary policy where a central bank reduces its balance sheet, thereby decreasing the money supply in the economy.”
This chart shows you the last few years of balance sheet activity over at the US Fed:

Source: Bloomberg
You can see the COVID spikes in purchases of both Treasuries and mortgage backed securities.
This flooded the market with liquidity. QT started in 2022 to slowly drain that liquidity out. But now it’s got to a point where liquidity is tight.
Hence the end of QT and the increase in volatility you’re seeing in markets now.
Maybe this over-tightening is outgoing Fed Chair Jerome Powell’s final revenge against big dog Trump?
Jerome Powell (JPow) is doing a little kiss off to Trump’s bull market before he gets swapped out for a more cooperative minion in May next year.
I maintain this is likely down to personal beef over a US$2.5BN renovation of JPow’s home in the middle of this year:
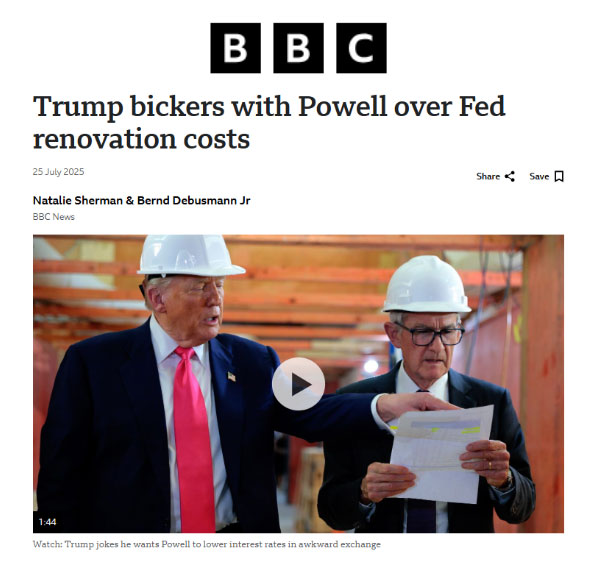
Source: BBC
Petty spats aside though, (remember these are serious people who know ever so much about the economy), there are some big debates playing out.
Some think the US Fed should continue shrinking its balance sheet, others say grow it.
But to avoid getting too obtuse in my analysis, here’s a final chart:

Source: Capital Wars
Investor exposure to China (green) increased over the last year, while their exposure to the US flatlined.
These capital flows could help fuel additional demand growth in their economy in conjunction with the liquidity from the PBoC.
Now combine that with Trump rolling back tariffs on key agricultural products so the collective Christmas dinner table isn’t as barren as it could be this year…
And I’d maintain that there are still some rays of hope – we just need the US Fed to do what they said they would do (stop reducing the balance sheet).
Then on the other side of the Pacific there is one key thing to watch too…
Lithium.
Here we have hope for a Santa Rally on the ASX fueled by the energy metal.
See below:
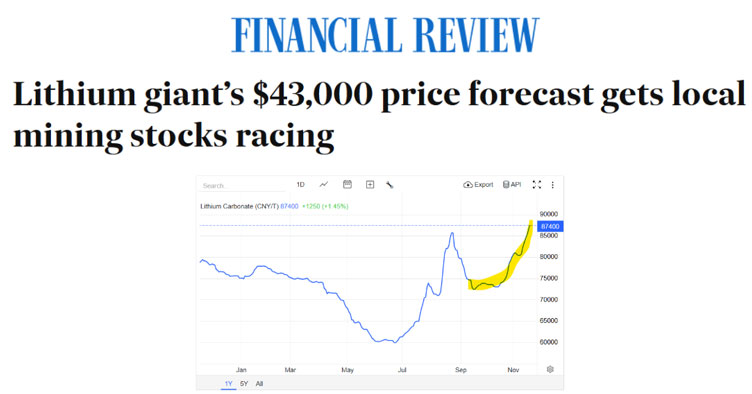
Source: Australian Financial Review and Trading Economics
Dare to dream.
I reckon the bull market is still mostly standing and the current level of dismemberment is merely a scratch:

By the way, I’ve recommended three excellent lithium development stocks to choose from in Australian Small Cap Investigator. Read about that here.
Best Wishes,

Lachlann Tierney,
Australian Small-Cap Investigator and Fat Tail Micro-Caps
***
Murray’s Chart of the Day –
ASX 200
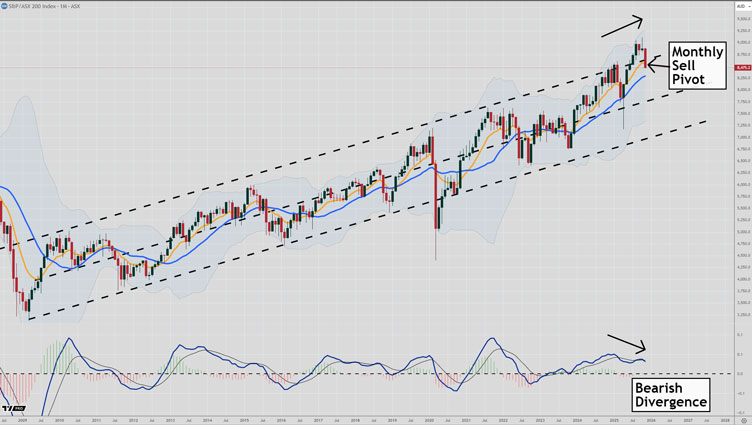
Source: TradingView
Markets move in cycles, but investors can’t help getting caught up in the moment when things are going their way.
After months of relentless buying the reversal of fortunes has been rapid.
How the S&P/ASX 200 [ASX:XJO] closes out this month will be important to watch.
The chart above shows you the channel the ASX 200 has been trading in for the past fifteen years.
The hope over the last few months was that stocks were breaking out of the channel and ready to go for a serious run.
That hope is fading fast as stocks re-enter the channel and a monthly sell pivot looks like being confirmed next week.
That will increase the odds of further downside to come before things balance up again.
The long-term trend is still pointing up, so we could see a quick correction that leads to another buy signal down the track.
But the fact the sell pivot will be occurring after an attempted breakout of the fifteen year channel means a bearish wave to the bottom of the channel isn’t out of the question.
The AI story is starting to come under pressure as investors balk at the immense levels of investment needed and there are questions around liquidity levels in the US market.
Perhaps liquidity has been affected by the US government shutdown and things will loosen up again soon.
All eyes are on Nvidia’s [NASDAQ:NVDA] earning results released tomorrow morning. Fingers crossed.
Regards,

Murray Dawes,
Retirement Trader and International Stock Trader

Comments