• Skip to primary navigation
  • Skip to main content
  • Skip to primary sidebar
  • Skip to footer

Fat Tail Daily

Investment Ideas From the Edge of the Bell Curve

  • Menu
    • Commodities
      • Resources and Mining
      • Copper
      • Gold
      • Iron Ore
      • Lithium
      • Silver
      • Graphite
      • Rare Earths
    • Technology
      • AI
      • Bitcoin
      • Cryptocurrency
      • Energy
      • Financial Technology
      • Bio Technology
    • Market Analysis
      • Latest ASX News
      • Dividend Shares
      • ETFs
      • Stocks and Bonds
    • Macro
      • Australian Economy
      • Central Banks
      • World Markets
    • Small Caps
    • More
      • Investment Guides
      • Premium Research
      • Editors
      • About
      • Contact Us
  • Latest
  • Fat Tail Series
  • About Us
Market Analysis Latest ASX News

Is Lovisa Holdings Share Price About to Fall Again? (ASX:LOV)

Like 0

By Lachlann Tierney, Monday, 21 September 2020

The popular women’s jewellery company took a beating through the first half of 2020.

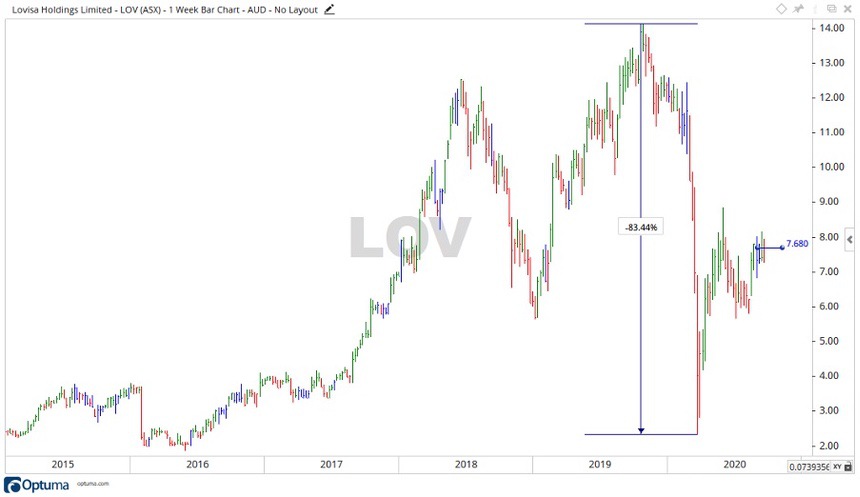
What started for Lovisa Holdings Ltd [ASX:LOV] as a bit of a pullback in October 2019, turned into a full-blown free fall as the COVID-19 pandemic got into swing.

Wiping off 83.44% of the LOV share price into the 2020 March low, Lovisa managed to recover somewhat to trade at $7.68 at the time of writing. But where to from here?

ASX Lovisa Share Price Chart 1

Source: Optuma

What’s going on with Lovisa?

From the start of 2019 Lovisa had been steaming along, their stock price boosted up over 150%, with stores operating in Australia and internationally in 15 countries.

Then along came COVID-19.

COVID-19 caused widespread lockdowns of public places including shopping centres worldwide.

The lockdown of stores due to the pandemic and the fall in global markets significantly impacted Lovisa’s stock price.

Falling from $14.13 in October 2019, which was an all-time high, to $2.34 in March 2020.

After a bit of a recovery the price is now moving sideways…where can it go from here?

Where to next for the Lovisa share price?

A lot of global economies are in a bit of a mess right now. That effects everything both good and bad no matter what business you are involved in.

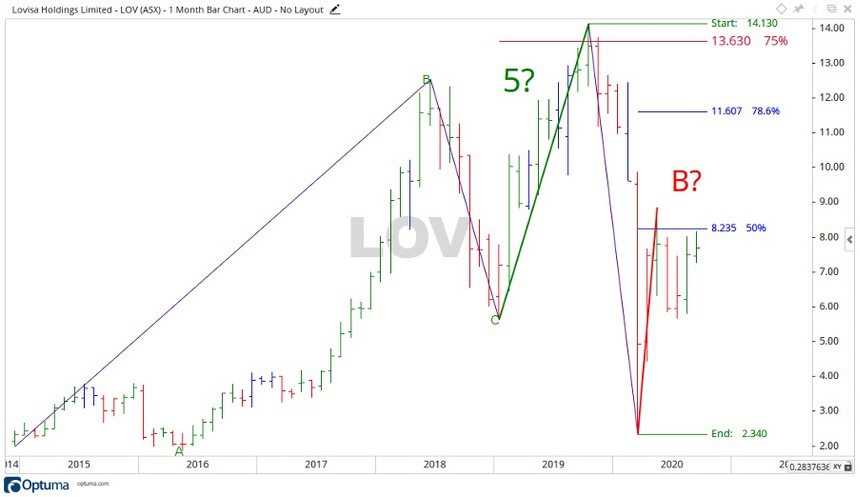
In the case of Lovisa we can zoom out to the monthly movements of the stock price, by taking in the wider picture it can help make assumptions about where the price may be heading.

ASX Lovisa Share Price Chart 2

Source: Optuma

By looking at a monthly chart and using Elliott wave theory it can give an idea of where the price is.

Wave 5 (the green one) moved up just over 75% of the previous impulse wave (purple one, wave 3) which is in line with the structure rules for wave 5.

The price then fell into a potential wave A before shooting back up.

This is the interesting bit.

The potential wave B moved up 50% of the previous wave — typical movement for a wave B is to retrace between 50–78.6% of the previous wave.

If this assumption proves to be correct, then the price may be moving to fall into another decline.

ASX LOV Share Price Chart 3

Source: Optuma

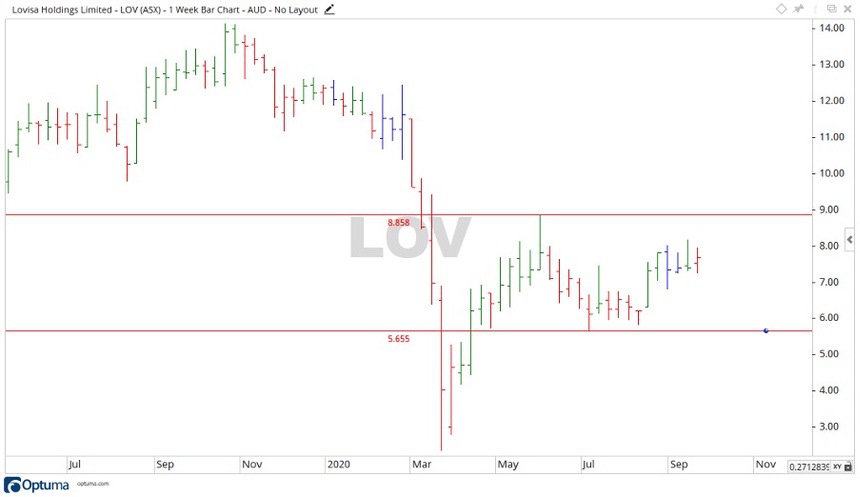
The last few weeks saw Lovisa move into a bit of a sideways pattern, indicating the direction of the stock is still up in the air.

With the most recent high being $8.58 and low being $5.65, one of these levels will have to be broken for the stock to be considered bullish or bearish.

Keep in mind to look for the supporting volume with any movement, as without confirmation of a move you may just be getting trapped in a false breakout.

Regards,

Carl Wittkopp,
For The Daily Reckoning

All advice is general advice and has not taken into account your personal circumstances.

Please seek independent financial advice regarding your own situation, or if in doubt about the suitability of an investment.

Comments

Subscribe
Notify of
guest
guest
0 Comments
Inline Feedbacks
View all comments
Lachlann Tierney

Lachlann’s Premium Subscriptions

Publication logo
Fat Tail Investment Research

Latest Articles

  • As Political Dumb-Wits Beat the Drums of War: Keep Commodities Front and Centre
    By James Cooper

    In today’s edition, James Cooper looks at the growing hostilities between Pakistan and India through the lens of the commodity cycle. And why it could matter more than most think.

  • The share market bears have no answer to this…
    By Callum Newman

    I came across a handy bit of info from Wilson Asset Management yesterday. Wilson says that there’s strong demand for Chinese assets despite the recent volatility and trade tensions. Why do we care? There could be profit in this.

  • The method in Trump’s tariff madness
    By Jim Rickards

    Trump is pursuing a twenty-first-century version of what was originally known as the American System. A system that made America great in the first place.

Primary Sidebar

Latest Articles

  • As Political Dumb-Wits Beat the Drums of War: Keep Commodities Front and Centre
  • The share market bears have no answer to this…
  • The method in Trump’s tariff madness
  • The first place to look thanks to the US/China truce
  • The trade war is over. Tax cut chaos is next.

Footer

Fat Tail Daily Logo
YouTube
Facebook
x (formally twitter)
LinkedIn

About

Investment ideas from the edge of the bell curve.

Go beyond conventional investing strategies with unique ideas and actionable opportunities. Our expert editors deliver conviction-led insights to guide your financial journey.

Quick Links

Subscribe

About

FAQ

Terms and Conditions

Financial Services Guide

Privacy Policy

Get in Touch

Contact Us

Email: support@fattail.com.au

Phone: 1300 667 481

All advice is general in nature and has not taken into account your personal circumstances. Please seek independent financial advice regarding your own situation, or if in doubt about the suitability of an investment.

The value of any investment and the income derived from it can go down as well as up. Never invest more than you can afford to lose and keep in mind the ultimate risk is that you can lose whatever you’ve invested. While useful for detecting patterns, the past is not a guide to future performance. Some figures contained in our reports are forecasts and may not be a reliable indicator of future results. Any actual or potential gains in these reports may not include taxes, brokerage commissions, or associated fees.

Fat Tail Logo

Fat Tail Daily is brought to you by the team at Fat Tail Investment Research

Copyright © 2025 Fat Tail Daily | ACN: 117 765 009 / ABN: 33 117 765 009 / ASFL: 323 988