• Skip to primary navigation
  • Skip to main content
  • Skip to primary sidebar
  • Skip to footer

Fat Tail Daily

Investment Ideas From the Edge of the Bell Curve

  • Menu
    • Commodities
      • Resources and Mining
      • Copper
      • Gold
      • Iron Ore
      • Lithium
      • Silver
      • Graphite
      • Rare Earths
    • Technology
      • AI
      • Bitcoin
      • Cryptocurrency
      • Energy
      • Financial Technology
      • Bio Technology
    • Market Analysis
      • Latest ASX News
      • Dividend Shares
      • ETFs
      • Stocks and Bonds
    • Macro
      • Australian Economy
      • Central Banks
      • World Markets
    • Small Caps
    • More
      • Investment Guides
      • Premium Research
      • Editors
      • About
      • Contact Us
  • Latest
  • Fat Tail Series
  • About Us
Market Analysis Latest ASX News

Is There any End in Sight for the Titomic Share Price Slide?

Like 0

By Lachlann Tierney, Monday, 21 September 2020

Forget about the effects of COVID-19 for a minute, the share price microcap Titomic Ltd [ASX:TTT] has been on the slide downwards since April 2019.

Year-on-year, TTT shares have lost 55%.

Investor reactions to news from TTT have been volatile to say the least.

Which makes it even more difficult to say where the share price could be heading coming into the next calendar year.

But with the broader ASX materials sector on the rise, there is some upside potential for TTT.
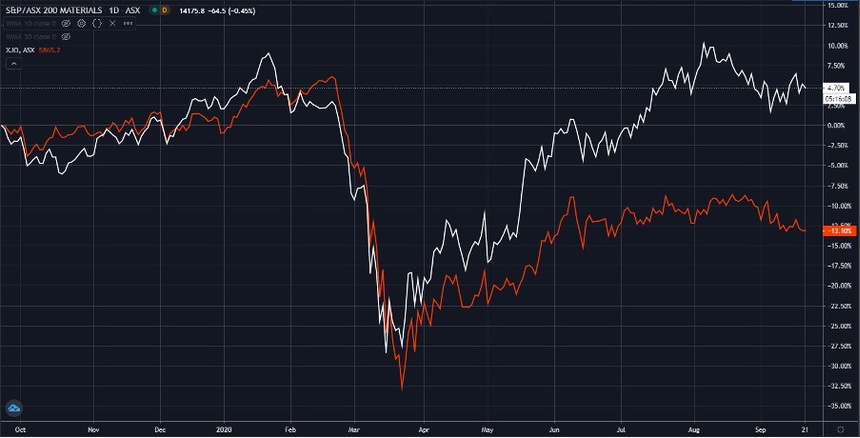
ASX TTT Share Price Chart 1

Source: Tradingview

Take a look at the graph above.

That’s the materials sector (white) versus the ASX 200 (red).

How Exposed Are You to an Aussie Recession?…and three steps to ‘recession-proofing’ your wealth. Download your free report now.

So, what could this mean for TTT?

Let’s take at look.

Who is Titomic Ltd?

Titomic Ltd is an Australian company.

It manufactures for industries needing lighter and stronger materials made from titanium.

It also helps industries produce corrosion resistance surfaces, ballistics protection and even improve surface friction.

The way Titomic achieves this is through technology it calls ‘Titomic Kinetic Fusion’.

This process involves metal powders moving at ‘supersonics speeds to create industrial scale parts and complex surface coating’.

Titomic uses titanium as its main metal for this fusion process.

The Titomic Kinetic Fusion process was developed by Titomic and CSIRO. The company has exclusive rights to this process.

Titomic’s target segments include aerospace and space.

This covers space manufacturing, tool moulds, special coating…

It also includes defence, consumer, mining, oil and gas.

Under these segments, Titomic can work with pipelines, valves and pumps. As well as sporting goods, bicycles and soldier systems for defence.

One of the benefits of Titomic is its ability to produce low cost products into the market at great speed. All while using less resources to do so.

Where is the Titomic share price heading?

As you can see in the graph below, the outlook for TTT shares isn’t looking too great.
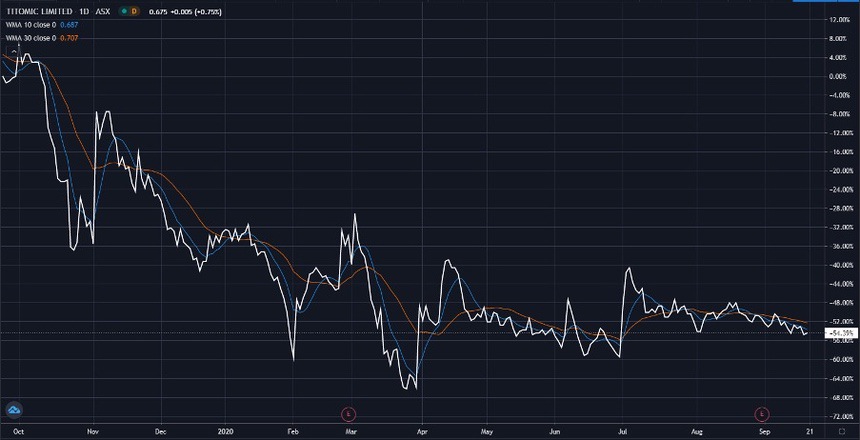
Titomic Share Price Chart 2

Source: Tradingview

In their full-year results, TTT flagged a net loss of $10.8 million.

Up 45% from the previous year.

Not a great result.

But there is a silver lining.

Despite the loss, TTT grew its revenue by 36% to ~$2 million.

Now, remember TTT is a start-up.

Meaning you shouldn’t expect huge profits, especially since it only listed on the ASX in October 2017.

So the strong revenue growth hints at a potential upside, particularly as the economy begins to recover from COVID-19.

In a brand-new report titled ‘The Looming Aussie Recession and How to Survive It’, Nick Hubble reveals why a recession in Australia is inevitable and three steps to recession-proof your wealth. Click here to receive your free report.

Regards,

Lachlann Tierney

For The Daily Reckoning Australia

All advice is general advice and has not taken into account your personal circumstances.

Please seek independent financial advice regarding your own situation, or if in doubt about the suitability of an investment.

Comments

Subscribe
Notify of
guest
guest
0 Comments
Inline Feedbacks
View all comments
Lachlann Tierney

Lachlann’s Premium Subscriptions

Publication logo
Fat Tail Investment Research

Latest Articles

  • The US$2 Trillion Stablecoin Tsunami
    By Charlie Ormond

    These developments could transform the US$250 billion stablecoin market into a US$2 trillion juggernaut within years.

  • Trump Sparks Rare Earth Rally
    By Murray Dawes

    Murray and Callum pointed out three lithium stocks last week that surged 5–12% this week. Now they look at copper and rare earths.

  • Copper Breaks Out: Are You Positioned?
    By James Cooper

    Last week, James Cooper wrote about the need to be on high alert for a copper breakout. This week, copper is breaking out… James lays out the game plan from here.

Primary Sidebar

Latest Articles

  • The US$2 Trillion Stablecoin Tsunami
  • Trump Sparks Rare Earth Rally
  • Copper Breaks Out: Are You Positioned?
  • A radically innovative industry set to soar
  • Debt and declining demographics are a dangerous combination

Footer

Fat Tail Daily Logo
YouTube
Facebook
x (formally twitter)
LinkedIn

About

Investment ideas from the edge of the bell curve.

Go beyond conventional investing strategies with unique ideas and actionable opportunities. Our expert editors deliver conviction-led insights to guide your financial journey.

Quick Links

Subscribe

About

FAQ

Terms and Conditions

Financial Services Guide

Privacy Policy

Get in Touch

Contact Us

Email: support@fattail.com.au

Phone: 1300 667 481

All advice is general in nature and has not taken into account your personal circumstances. Please seek independent financial advice regarding your own situation, or if in doubt about the suitability of an investment.

The value of any investment and the income derived from it can go down as well as up. Never invest more than you can afford to lose and keep in mind the ultimate risk is that you can lose whatever you’ve invested. While useful for detecting patterns, the past is not a guide to future performance. Some figures contained in our reports are forecasts and may not be a reliable indicator of future results. Any actual or potential gains in these reports may not include taxes, brokerage commissions, or associated fees.

Fat Tail Logo

Fat Tail Daily is brought to you by the team at Fat Tail Investment Research

Copyright © 2025 Fat Tail Daily | ACN: 117 765 009 / ABN: 33 117 765 009 / ASFL: 323 988