

• Skip to primary navigation
  • Skip to main content
  • Skip to primary sidebar
  • Skip to footer
  • Home
  • Latest
  • Videos
  • Series
  • E-Newsletters
    • Fat Tail Daily
    • James Cooper’s Mining Memo
    • The Daily Reckoning Australia
  • Categories
    • Commodities
    • Macro
    • Market Analysis
    • Small Caps
    • Technology
  • Investment Guides
  • Premium Services
  • Editors
  • About
  • Contact Us
Fat Tail Daily
Subscribe
  • Home
  • Latest
  • Videos
  • E-Newsletters
  • Premium Services
Closing Bell

Is It Time to Go Fishing?

Like 0

By Murray Dawes, Friday, 18 September 2026

With US bond yields rising and the 10-year yield reaching a level last seen in 2007, Charlie and I step back to examine the 40-year cycle in interest rates and what bear flattening of the yield curve has meant for stocks.

Charlie and I got together on Thursday morning because I managed to snag some tickets to the Swans v. Fremantle Preliminary Final, so I will be in transit today with my son Daniel.

The US Fed has just raised interest rates for the first time in three years, as long-term bond yields are rising worldwide.

The US 10-year bond yield just tapped its highest level since June 2007, which is a tad ominous.

So Charlie and I thought it might be useful to jump on a plane and grab a bird’s-eye view of US interest rates to provide some context for current moves.

We show you the 40-year cycle in US 10-year bond yields, the history of bear flattening in the US yield curve and its effect on stocks.

Until we see an inversion of the yield curve, there is no need to take fright, but there are certainly enough warning signs around to say that stocks may be in for a rough road over the next few months.

Not only is it a seasonally terrible time for markets, but oil prices remain elevated with a rising risk of a serious dislocation event if the war in Iran continues for a long time.

The S&P/ASX 200 [ASX:XJO] looks a lot sicker than US stocks, with the 20-month simple moving average the next support level to watch, just below current levels.

US stocks continue to look strong, but if the weekly trend turns down, odds will rise that a correction of some sort is on the cards.

Charlie gave you a great quote this week in one of his articles that I want to repeat here. It was by the famous trader Jesse Livermore.

He said, ‘There is a time to go long, a time to go short, and a time to go fishing’. I reckon fishing is the best course of action right now.

Or in my case, it’s a time to go watch the Swannies kick Freo’s butt.

Closing Bell
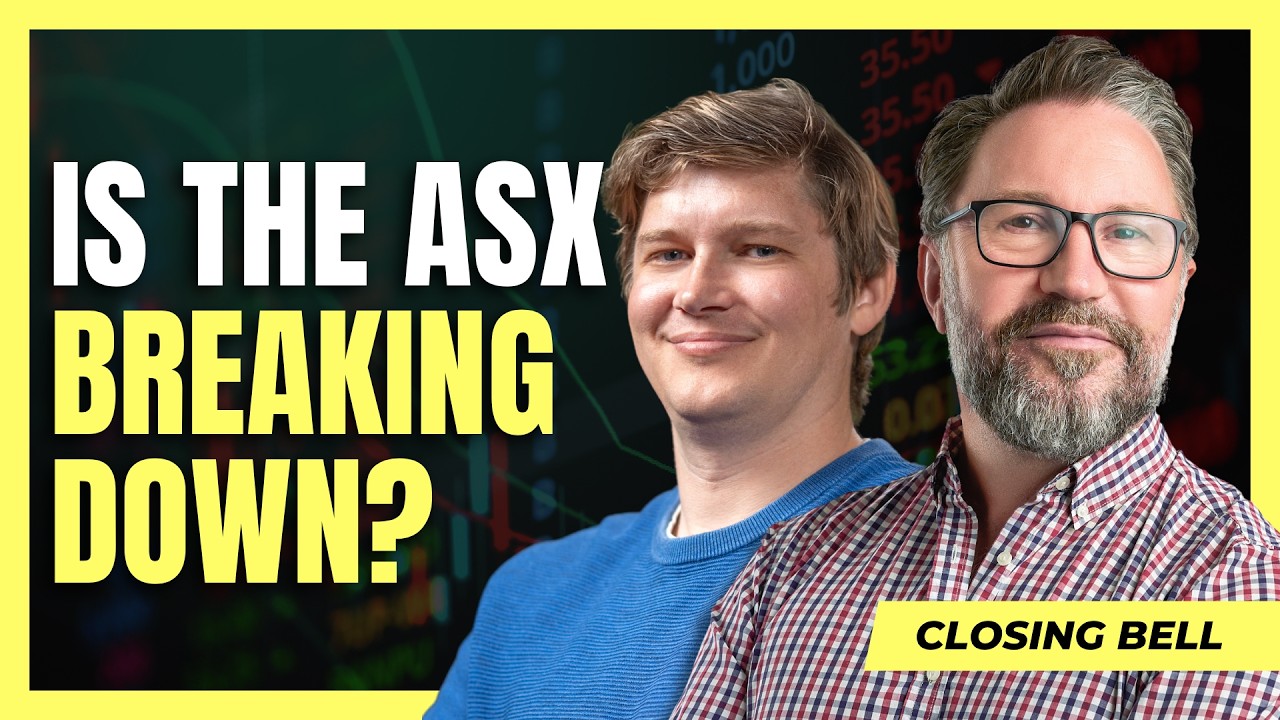
YouTube player

Regards,

Murray Dawes,
Retirement Trader, International Stock Trader and
Murray’s Trading Room

PS: In just one hour, I can show you how to get better at picking stocks… better at timing your entry… better at managing your risk… and better at knowing when to sell. You’ll learn all of this in my new online investing masterclass – free for a limited time. Go here for access.


All advice is general advice and has not taken into account your personal circumstances.

Please seek independent financial advice regarding your own situation, or if in doubt about the suitability of an investment.

Comments

Subscribe
Notify of
guest
guest
0 Comments
Murray Dawes

Murray Dawes is our resident expert trader and portfolio manager. He is a former Sydney Futures Exchange floor trader who went on to design custom trading systems and strategies for ultra-wealthy clients (including one of Australia’s richest families). Today, his mission is to help ordinary Aussie investors make profitable investments, while expertly managing risk.

He uses his proprietary system for his more conversative and longer-term-focused service Retirement Trader

Murray’s Premium Subscriptions

Publication logo
International Stock Trader
Publication logo
Retirement Trader

Latest Articles

  • Is It Time to Go Fishing?
    By Murray Dawes

    With US bond yields rising and the 10-year yield reaching a level last seen in 2007, Charlie and I step back to examine the 40-year cycle in interest rates and what bear flattening of the yield curve has meant for stocks.

  • The Black Box Problem
    By Charlie Ormond

    The AI labs have asked to be slowed down. Critics call it regulatory capture. The truth is somewhere in between. A black box forming inside the newest models is why this matters now.

  • Why the oil spike has not crashed the markets: Comparing 2026 with 2022
    By Brian Chu

    As the conflict in the Middle East takes another alarming turn, concerns are rising over whether this could drive the global economy into a 1970s market shock. Before we go back 50 years, let’s compare today with four years ago…

Primary Sidebar

Latest Articles

  • Is It Time to Go Fishing?
  • The Black Box Problem
  • Why the oil spike has not crashed the markets: Comparing 2026 with 2022
  • Gina and Elon = Robot magnet rock
  • All In: America Has Never Leaned This Hard on Stocks

Footer

Fat Tail Daily Logo
YouTube
Facebook
x (formally twitter)
LinkedIn

About

Investment ideas from the edge of the bell curve.

Go beyond conventional investing strategies with unique ideas and actionable opportunities. Our expert editors deliver conviction-led insights to guide your financial journey.

Quick Links

Subscribe

About

FAQ

Terms and Conditions

Financial Services Guide

Privacy Policy

Get in Touch

Contact Us

Email: support@fattail.com.au

Phone: 1300 667 481

All advice is general in nature and has not taken into account your personal circumstances. Please seek independent financial advice regarding your own situation, or if in doubt about the suitability of an investment.

The value of any investment and the income derived from it can go down as well as up. Never invest more than you can afford to lose and keep in mind the ultimate risk is that you can lose whatever you’ve invested. While useful for detecting patterns, the past is not a guide to future performance. Some figures contained in our reports are forecasts and may not be a reliable indicator of future results. Any actual or potential gains in these reports may not include taxes, brokerage commissions, or associated fees.

Fat Tail Logo

Fat Tail Daily is brought to you by the team at Fat Tail Investment Research

Copyright © 2026 Fat Tail Daily | ACN: 117 765 009 / ABN: 33 117 765 009 / ASFL: 323 988