
Life just keeps getting more expensive, doesn’t it? On Monday, the Tax Office released data showing that the average Australian earns about $60,000.
That’s not much when you consider how inflation erodes wages.
Saving is difficult at best. Maintaining your standard of living year after year is harder than hitting a bull’s-eye while blindfolded!
The most frustrating aspect is that you hear from experts appearing on TV telling you everything is fine.
They rattle out official statistics to support their claims. You go onto these sites and it is there.
What is wrong then? Your perception of reality or the experts and their numbers?
It is hard to argue that you know better than the experts, right?
Let me tell you what I discovered with a little research…
The CPI does not tell the full story
The March quarter 2021 CPI came out in late April. It showed that price levels rose 0.6% over the quarter.
That’s up 1.1% compared to the March quarter 2020.
The price level is rising between 2–3% each year based on this data.
Looks like inflation is under control, right?
Let us have a look at the trend in Sydney from the September quarter 1989 to the March quarter 2021:
|
|
| Source: Australia Bureau of Statistics |

The figure above shows the CPI in Sydney increased at a consistent rate. The smoothness of this trend hides a lot of what is really occurring beneath the surface.
This is often the case with aggregate numbers.
You have some categories (usually utilities, healthcare, and education) that will rise faster than others in a quarter. Then there are categories (recreation, clothing) that will rise slower.
I will let you in on some interesting findings I made when I dug deeper into the CPI figures.
How to Survive Australia’s Biggest Recession in 90 Years. Download your free report and learn more.
Tricking your eyes
The cost of food and drinks in Sydney rose at an average of 2.7% each year from 1989 to now.
During the same period, the cost of alcoholic drinks and tobacco rose by 5.6%.
I chose these two for a very good reason.
We know for a fact that our grocery bills have been rising by more than what the CPI suggests. Those who drink alcohol or smoke are probably not as surprised.
So, where is the discrepancy?
I hazard a guess that shrinkflation and brand substitution are hiding the price changes in food and drinks.
Most of you know what shrinkflation is.
A large pack of Kettle chips is normally selling for $4 at major supermarkets. But the weight has dropped from 200 grams to 155–175 grams in the last 10 years.
The CPI measures what is in a typical basket of goods and services. It does not discern the weight. People have not yet moved to buying two packs of chips instead of one.
The other is brand substitution. People are switching to supermarket brands to save on costs.
This is a little harder for alcoholic drinks and tobacco. You do not see bottle shops selling 700mL bottles of wine nor cigarette packets with less inside.
I dare say if food and drink packages have not changed, then the price rise would be similar to that of alcoholic drinks and tobacco. This would easily push the CPI to at least 3–4%.
Where did your electricity bills go?
I studied the CPI and its components back in 2017 to get a better idea of how our economy is faring. Coming back to this recently, I found that the category for electricity is no longer there.
I understand that it has merged into the Housing category along with water and gas. They now sit under the Utility sub-category.
My concern is they have merged these categories and hid things out of our sight.
My calculations showed electricity prices increased by 5.5% each year from 1989 to 2017. How about 2019–20? You can refer to the below (and can check the site yourself here, if you like):
|
|
| Source: RBA |
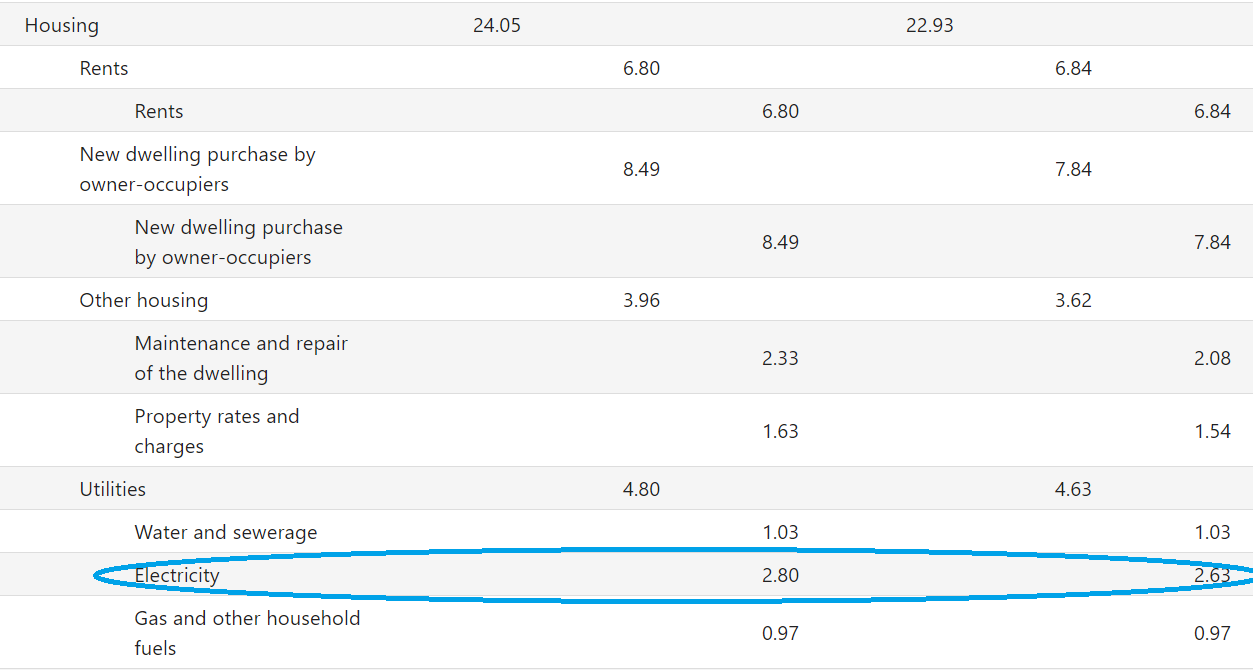
You can see that the cost of electricity rose by almost 6.5%.
In summary, the aggregate CPI suggests inflation is quite low at 2–3%. However, we find that the costs of necessities such as food and drinks, electricity, healthcare, and education are rising much faster.
It is hidden in plain sight.
There is a lot more than meets the eye with the CPI. But you knew that already, didn’t you?
What’s one way to protect yourself?
Personally, I like physical gold.
Today’s Australian reveals that physical gold has compounded higher at 8% per annum since 1970 (though in a very volatile way, it must be said).
I’m amazed to see this in a mainstream paper. The mainstream used to suggest buying gold was simply for gold bugs and doomsters.
But the inflationary impact of central banks is now making them question their dismissiveness.
If you’re feeling the pinch of a rising cost of living, one way to turn the odds back in your favour is via investing in gold and gold stocks.
Regards,
 |
Brian Chu,
Editor, The Daily Reckoning Australia
PS: Our publication The Daily Reckoning is a fantastic place to start your investment journey. We talk about the big trends driving the most innovative stocks on the ASX. Learn all about it here.
