
An economics organisation has commissioned me to write a paper on the Australian land cycle.
The purpose? To prove an average 18-year pattern of boom and bust while warning of the forthcoming downturn into 2028.
Importantly, the paper will also make policy recommendations to buffer the downturn’s impact and restructure the economy — following moving taxes off labour and productivity and instead collecting the monopoly rent from land and natural resources.
Not that I imagine much notice will be taken of these recommendations!
The greed and vested interests that underpin the cycle ensure it continues to repeat.
Still, the task seemed like an easy one initially.
After all, I write about the land cycle weekly.
However, there’s a problem.
We do not have an 18-year cycle in Australia.
Or, at the least, not one that can be proven with any clear metric!
You need to be aware of this if you want to navigate the indicators that will give us forewarning of the impending downturn into 2028.
Let me explain.
In Australia, the 18-year cycle — although somewhat evident in the stock market (I’ll come to this a little later) — has not always been clear in the real estate market.
This is because it can only be seen when there is speculation on rising land values.
You might find it hard to believe, but land prices in Australia have remained stable and affordable for long periods of our history.
Rent control and federal land taxes play a part.
Rent controls were implemented in Australia following the Great Depression and the Second World War.
The controls were introduced in response to calls to address housing affordability.
(It’s close to a 90-year repeat of what we’re seeing platformed by various political figures today — with the Greens calling for a rent freeze.)
At this time, the government imposed restrictions on the amount landlords could charge for rent, thereby preventing significant increases.
However, the rent control rules became even stronger in 1941 with a declaration that rents should be frozen to what they were in 1940!
It was certainly not a popular move with landlords, and reports suggest many exited the market in response.
After the rent controls were eventually removed — in the early 1950s, however, there was a notable impact on property prices.
When the restrictions were lifted, however, the demand for rental properties surged!
Landlords sought to recoup their previous losses and make up for lost income.
It led to a marked spike in property prices.
You can see this evidenced on the chart below in the red circle. It was pretty significant.
|
|
| Source: LF Economics (edited by Catherine Cashmore) |
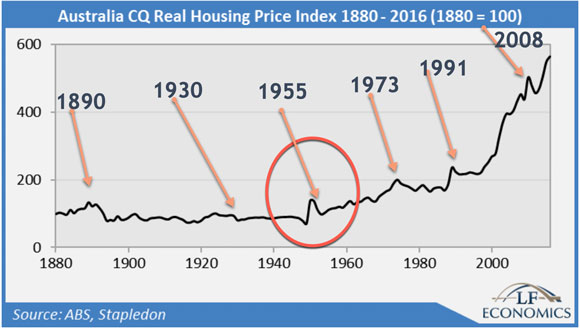
(I have also arrowed the significant ‘crash’ points that correlated with end-of-cycle downturns in the US/UK.)
Outside of these short-term volatile movements, Australia experienced land-led downturns in the 1840s, 1890s, and 1930s (correlating with end-of-cycle downturns in the UK and US) — but there was never a recognisable 18-year pattern through this period!
Of course, in today’s interconnected world, with heightened synchronisation of economic cycles across the Western world — the traditional boom and bust patterns in the US reverberate across economies worldwide.
After 1950, migration increased, and prosperity improved.
More women joined the workforce.
Neoliberal economics took over.
This eliminated land (as a factor of production) from the economic textbooks.
Mortgage debt soared.
Restrictive land policies resulted in massive land price inflation on the outskirts of cities.
Tax policies favoured landlords and penalised workers.
As a result, we can trace a more consistent boom/bust real estate cycle in Australia.
And if we are to go by the US cycle, the dates of the previous three we have correlated with run as follows.
- First cycle: 1955–1974
- Second cycle: 1974–1992
- Third cycle: 1992–2010
Should history repeat itself, our current cycle runs from 2010 to a bottom in around 2028.
However, even with downturns evident through this period of recent history — and the UK and US both falling into recession consistently at the end of the cycle — Australia was not in recession in the 1950s or between 2008–2010.
Therefore, neither can we use the period between technical recessions to prove there is a regular 18-year boom/bust cycle.
Of course, the reason for avoidance of the last recession in 2008 is easy to explain.
When the ‘shock’ of the GFC hit Australia in 2008, Treasurer Wayne Swan took a call from US Treasury Secretary Hank Paulson.
‘Paulson: “Look…if we can avoid a meltdown in house prices, then we might be able to see a way through this,” he said. This was a big “if”, and I suspect the real motivation behind his call.
‘It seemed a dicey prospect that the health of the entire US economic system was underpinned by the housing market stabilising, given that it was the very stench of toxic home loans that had, only a few months earlier, brought to their knees two of the managed hedge funds run by Bear Stearns, one of America’s oldest investment banks.’
The Good Fight,
Wayne Swan, 2014
The message was clear — the real estate market was too big to fail.
Kevin Rudd did the only thing he could.
Assisted by a decade-long commodity boom, he threw every last penny of Australia’s budgetary surplus (and then some) into supporting land prices.
Strict rules on foreign investment were lifted, first home buyers were gifted with grants in excess of $30,000, and millions were poured into infrastructure upgrades.
As a result, the peak in the Australian real estate cycle was pushed past the peak of the cycle in the US.
After an initial downturn in the second quarter of 2008, the incentives produced a surge in median values into a new 2010 peak.
It could be seen as coming right on cue.
It was 14 years after the 1996 low — two to three years after the US peak.
It’s one reason that — while I expect US property prices to peak in 2025 — Australian property prices are still forecast to peak in 2026.
This would be 14 years post the initial rise in median values in 2012 — following a ‘lull’ between the peak in 2010 and 2012 commencement of the upswing into the first half of this cycle.
2012 + 14 = 2026.
Best wishes,
 |
Catherine Cashmore,
Editor, Land Cycle Investor

Comments