
Why does Rio Tinto [ASX:RIO] want to merge with Glencore [LON:GLEN]?
Copper is the simple answer.
So as the commodities bull really gets going this year, today’s note focuses on two commodities pushing upwards along with the rest of the commodities complex.
I’ll also profile one Aussie small-cap benefitting from interest in both commodities.
Copper is all the rage right now
Rio and Glencore are in talks about an all-share combination that would create a US$200-plus billion mining giant.
The goal: a dominant copper position just as demand surges from renewables, EVs, AI data centres and grid upgrades.
Copper is the prize because it sits at the junction of three powerful trends: decarbonisation, re-industrialisation and the AI build-out.
Copper is up to around US$6 per pound that’s all-time high territory.
AI data centres are a big part of this.
A study of Microsoft’s Chicago facility found it used about 2,177 tonnes of copper or roughly 27 tonnes per megawatt of applied power.
High-end AI racks draw four to six times the power of traditional servers, driving much heavier copper busbars and power distribution units.
Cooling systems account for about 40% of copper usage in AI-focused data centres.
Copper saturates the EV ecosystem too.
A typical battery-electric car contains around 80–83 kilograms of copper.
Then you have the charging network.
Each charger adds roughly 0.7 kilograms of copper for a slow 3.3 kW unit and up to 8 kilograms for a 200 kW fast charger.
In short: Rio knows its future cannot hang on iron ore alone.
Glencore brings a huge copper portfolio across the DRC, Zambia and South America, while Rio contributes Oyu Tolgoi and Resolution.
The logic is simple: lock up copper now, before supply deficits bite harder later in the decade.
Zinc matters more than you think
Zinc will never grab headlines like copper, but it’s just as essential.
Zinc is trading at around US$3,230 per tonne, over the last 7 months, the trend is steadily up.
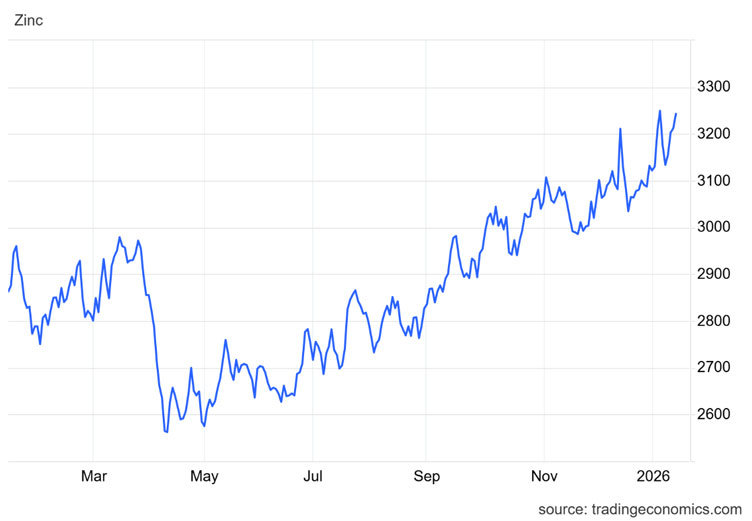
Source: TradingEconomics
Most of that metal stops everything else from rusting.
Global zinc use is primarily tied up in galvanisation processes (60%).
Zinc is a corrosion insurance policy for steel.
Think bridge girders, transmission towers, solar frames, offshore wind foundations.
Construction accounts for about half of global zinc demand, with transport and broader infrastructure soaking up much of the rest.
More importantly, Zinc is leveraged to many of the same themes driving copper: grid expansion, renewable roll-outs and heavy infrastructure stimulus across Asia and the Middle East.
It’s “boring” only because demand is embedded in engineering standards.
One Aussie small-cap benefitting from both
|
Develop Global [ASX:DVP] has built itself into a great play on copper and zinc, with a lithium kicker. Market cap is roughly A$1.1 billion.
What adds a string to its bow is its mining services business, which generates ~$200M in revenue.
As for mining, it’s got two strong assets.
One project, called Woodlawn in NSW, is a high-grade underground zinc-copper mine now ramping to 850,000 tonnes per year with potential to push towards 1.35 million tonnes.
The resource stands at 11.3 million tonnes grading 1.8% copper and 5.8% zinc.
That copper grade is quite impressive in this day and age, let me tell you.
Then there’s Sulphur Springs in WA, which is a high-grade zinc-copper development with a resource of 17.4 million tonnes at 5.8% zinc and 1.0% copper.
An updated DFS outlines 79,000 tonnes of zinc and 12,000 tonnes of copper per year with strong economics.
It has a lithium project too — which is nothing to shrug at given the lithium price recently:

Source: TradingEconomics
An 11.2Mt resource at 1.2% Li2O with a scoping study pointing to 200,000 tonnes of 5.5% spodumene concentrate yearly.
It all adds up to a powerful cocktail of commodities stories in one company.
And is part of the reason DVP is up ~10% in the first two weeks of the year.
Certainly one for your watchlists.
Best Wishes,

Lachlann Tierney,
Australian Small-Cap Investigator and Fat Tail Micro-Caps
***
Murray’s Chart of the Day – US Yield Curve
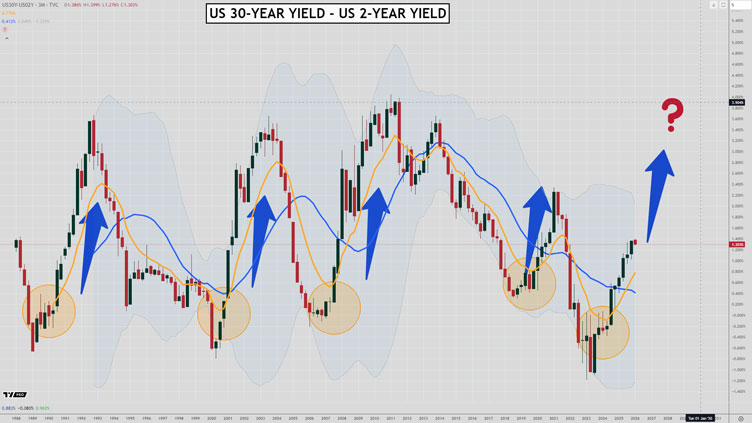
Source: Tradingview
This could be the most important chart for 2026.
It is the US 30-year bond yield minus the US 2-year bond yield.
It tells you how steep the yield curve is, or how much higher long-term rates are than short-term rates.
Trump is playing with fire in his attempts to bully the US Fed into lowering interest rates.
It’s clear that the criminal investigations into Chairman Powell are politically motivated.
I don’t know about you, but I don’t want Trump to be in control of interest rates.
That’s not because I have Trump Derangement Syndrome. It’s because there is only one direction a politician wants interest rates to go. Down.
The independence of the US Fed is a big deal.
With Powell’s term nearly up and the new Fed Chairperson not far from being announced, this story will likely take centre stage on the front pages over the next few months.
The big unknown is how bond markets will react if they decide Trump has captured the Fed.
If rates start to drop despite strong growth and bubbling inflation, you can bet the yield curve will continue to steepen.
The chart above shows the path of the yield curve since 1988.
The thing to note is that the current steepening shows no signs of weakening, and past steepening periods usually continue to much higher levels (close to 4% from the current 1.3%).
That is usually caused by the Fed panicking during a growth scare and dropping rates to near zero while 30-year yields remain close to the same level.
If the Fed drops rates without any signs of trouble and starts to run the economy hot on Trump’s orders, we may see strong growth initially, but the long-term outcome could be worse if inflation takes off again.
Regards,

Murray Dawes,
Retirement Trader and International Stock Trader

Comments