There’s been a lot of coverage over the SVB banking collapse in the US, and for good reason…
It’s the second biggest collapse since Lehman Brothers in 2008.
But what about the other elephant in the room?
We’ll be taking a step back from SVB today with a focus on China, the big issue for commodities.
As you’ll recall, sentiment around China’s economy was decisively bearish for much of last year.
With a looming property crash and no end to COVID lockdowns, the situation looked dire.
But almost overnight, the mood swung back to positive territory…
In a rare moment of civil dissent in China, President Xi Jinping panicked and backflipped on his hard-line lockdown stance in late 2022.
The stage was set, the nation was ready to reignite growth back to its pre-pandemic levels.
In terms of China’s long-term growth outlook, 2023 started with a bang!
Commodities surged.
Mining stocks burst into all-time new highs…
BHP glided past its 2011 historical peak from the last mining boom.
However, that reopening story has well and truly run out of steam.
Just last week, officials in China downgraded the nation’s growth target to a measly 5% of GDP, the lowest in a quarter-century.
Investors took to the exits as they jumped out of Chinese investments.
A booming reopening story has been replaced with renewed fears of a property crash.
As you might recall in 2022, commentators predicted a major real estate slowdown in China.
That was thanks to the financial miseries of China’s second-largest property developer, Evergrande.
Like the SVB situation we have in the US right now, Evergrande was supposed to be China’s Lehman Brothers moment.
A repeat of the 2008 financial meltdown that shocked financial markets across the globe.
It never happened.
But with those fears once again resurfacing, does Australia’s mining industry rest on borrowed time?
According to Forbes, China rests on shaky ground (emphasis added):
‘The Chinese economy is faltering. The risk of a real recession looms large, and the most optimistic scenario under current leadership would be slow growth, far slower than in recent decades.’
Forbes highlights youth unemployment of nearly 20% and home sales declining 40% in 2022 as key reasons to be negative on China’s outlook.
Falling revenues for its major tech titans including Alibaba and Tencent are also factors highlighted by the China bears.
On the face of it, Australia’s most important trading partner looks decidedly weak.
It certainly does not bode well for a commodity wide boom, which was one of my predictions for 2023!
That was confirmed by the federal government’s latest budget outlook, which was also decisively bearish on commodity prices across 2023 and 2024…
The crystal ball gazers at the Treasury department expected iron ore to slump to around US$55/tonne by the end of Q1 2023.
That was mostly attributed to ongoing weakness in the Chinese economy.
But right now, just two weeks away from that timeline, iron ore is maintaining a steady level of around US$133/tonne.
More than double the budgets forecast!
That’s despite unprecedented threats to the global economy.
It’s why I pay little attention to mainstream forecasts, particularly those centred around Chinese growth.
And let’s face it, the past performance of these professional institutions has been dreadful in recent years.
Have mainstream economists got the China story wrong?
Economists failed to predict the 2008 Global Financial Crisis.
They were profoundly incorrect in their calls for a property meltdown over 2020 and 2021 following the pandemic outbreak.
And I believe they’ll be proven wrong, yet again, in their predictions for a major economic slowdown in China.
How can I be so sure?
Reviewing long-term trends for important growth-related stocks give us clues for the future of China’s economy.
Charts offer an unbiased assessment of the current state of play in markets.
If you know how to read them correctly, they can be a valuable tool in understanding whether market fear is warranted.
Today, we’re going to try and understand the real China story.
I’ll start by reviewing some of the largest listed steel producers in China…steel production is a key indicator of future growth.
It’s a key material used in real estate development and infrastructure.
Price action among China’s large steel producers will help gauge the future trend of the sector and the Chinese economy more broadly.
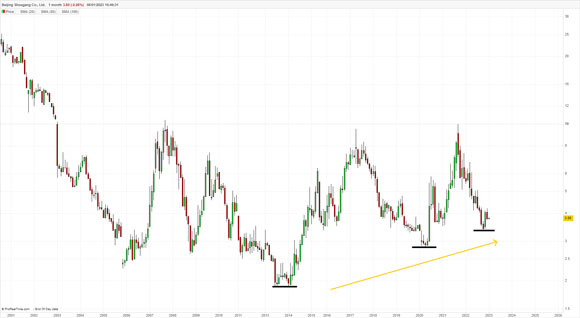
First off is Shougang Group…a Chinese steel producer that supplies around 35 million metric tonnes of steel each year.
If China’s economy was on the verge of collapse, as many economists predict, steel firms like Shougang will be among the first to sell off.
Yet, this is simply NOT happening.
As you can see below, the company’s chart does not paint a bleak picture.
Each major low since bottoming in 2014 has consolidated and held for a long-term uptrend…
This is certainly a positive signal for the company as its price continues to strengthen.
|
|
| Source: ProRealTime |
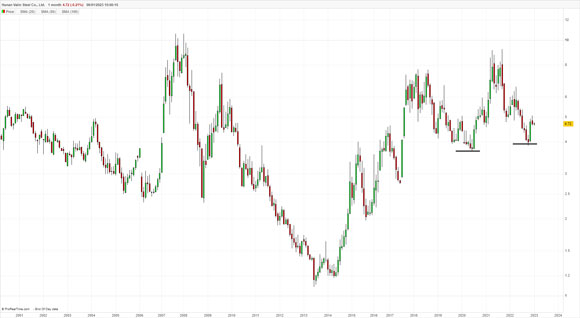
It’s a similar trend for other major steel producers in China…Hunan Valin Steel’s price continues to consolidate and hold support around $4.00:
|
|
| Source: ProRealTime |
It’s achieved this despite nationwide lockdowns for three years and a pause on economic activity…again, Hunan’s chart does not signal an impending crisis in the Chinese economy.
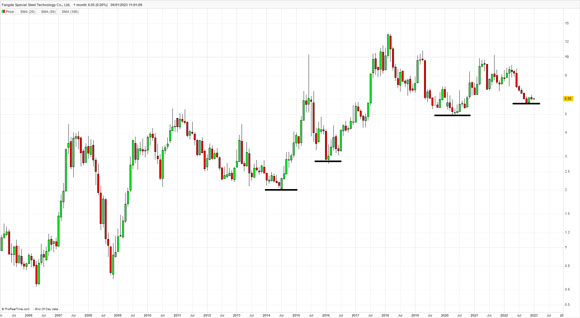
Lastly, we have Fangda, another steel-producing titan in China.
Fortunately for us, the company is listed, offering further evidence of price action in the Chinese steel making industry, which suggests strength, not weakness.
In fact, the company’s share price is approaching near all-time highs:
|
|
| Source: ProRealTime |
Since 2014, the company has recorded four major lows on its long-term chart.
Again, these lows continue to form a higher base as prices hold strong support above previous lows.
Recent price consolidation is another key indication that the company is in a relatively strong position despite enormous external pressures bearing down on its outlook.
So there you have it…charts of three major listed Chinese steel companies all demonstrating solid price action, which seems to be at odds with what we’re being told about the Chinese economy.
And that’s being backed up by some hard data on the ground…
According to the General Administration of Customs — China’s border agency — the nation purchased 194 million tonnes of iron ore over January/February 2023.
That compares to 181 tonnes purchased over the same period in 2022 or a 7.3% increase.
Far from an imminent crash, rising iron ore imports offer solid evidence that Chinese steel manufacturers are anticipating strong growth for their products, both domestically and internationally.
Significantly, too, the customs authority reported an enormous growth in Chinese steel exports, with a 49% increase over January/February.
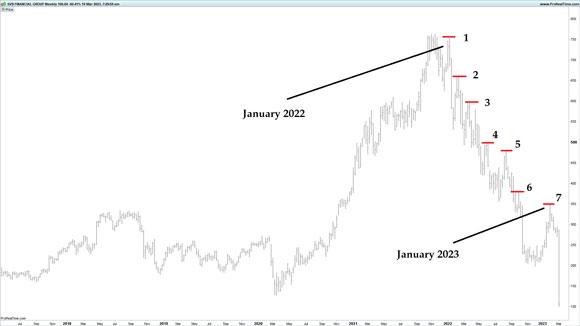
Now let’s compare that to a stock chart that is (or was) weak…SVB Financial Group.
As you can see from the weekly chart, the company was stuck in a long-term downtrend that started in January 2022:
|
|
| Source: ProRealTime |
The downtrend could be characterised using different methods; the most obvious is ‘lower highs’ marked in red.
Each lower high suggested ongoing price weakness…a time to sell.
This was a pattern repeated seven times before the stock finally capitulated last Friday.
That is seven ‘lower highs’ in just a little over 12 months.
Investors (and deposit holders, for that matter) had SEVERAL opportunities to jump ship if only they held some basic chart reading skills.
So, why is that important?
What I’ve come to understand about charts is that prices tend to move well ahead of the news.
As prices trend up or down, the reasons at the time may not seem obvious.
Just like our iron ore producers in China that are holding up well, despite calls of an imminent property crash and slower growth targets…
Prices seem to be at odds with what’s happening in the market.
That’s because a chart is a forward-looking indicator.
As economists, investors, governments, deposit holders, and financial commentators throw their hands up in shock and disbelief over the second-largest banking crash in US history…
…in terms of the price action, the message was clear…the company was in big trouble.
So, who should you trust when it comes to understanding
the China story?
As they say, if you want the real truth, then you must follow the money.
In investing, you follow the money by referring to the charts.
Price weakness or strength is governed by the scale of buyers and sellers in the market.
It’s the best possible information we have in making predictions about the future.
Right now, the charts of major steel producing firms are pricing in future growth.
Buying activity is strong for these companies…it’s the clearest indication we have for future strength in the Chinese economy.
The reasons may not seem obvious right now, but the evidence is not found in official data…it’s on the ground, tightly held by the companies’ major shareholders and management team.
These are the insiders that drive share prices higher or lower based on market conditions well ahead of public knowledge or official statistics.
As 2023 unfolds, I’m sure the real reasons why China is set to defy economists’ predictions will come to light.
As an investor, it means you should continue capitalising on any market weakness in 2023…
This means adding quality mining stocks to your portfolio.
We’re experiencing one of those weak periods in the market right now.
Despite the challenges being felt by investors, nothing has changed the long-term outlook…the stage is set for unprecedented growth in the mining sector. Are you ready?
Happy investing.
Regards,
 |
James Cooper,
Editor, The Daily Reckoning Australia


