Transplanting an older head onto young and not-so-young shoulders has rarely been successful.
Yet, in spite of the high rate of rejection, a few of us oldies persist in our efforts to make people a little wiser before the event.
The adage of ‘seeing is believing’ is why alerting people to something very few have experienced or can recall experiencing is so damn difficult.
When you’ve been conditioned to an environment of low inflation, low interest rates, rising asset markets, and (almost) continual GDP growth, the prospect of a future that’s entirely different is almost inconceivable.
Telling people in the heady days of the Roaring Twenties of what the 1930s had in store — collapsing share markets, economic depression, mass unemployment, and a World War — would have been a futile exercise. In the midst of a boom, it’s nigh on impossible to comprehend a world that’s completely at odds with your lived experience.
The investment industry has successfully marketed the ‘it’s time in the market’ and ‘shares always go up in the long term’ narrative.
Most people accept these industry ‘truisms’ as gospel.
Shares for the long term…really?
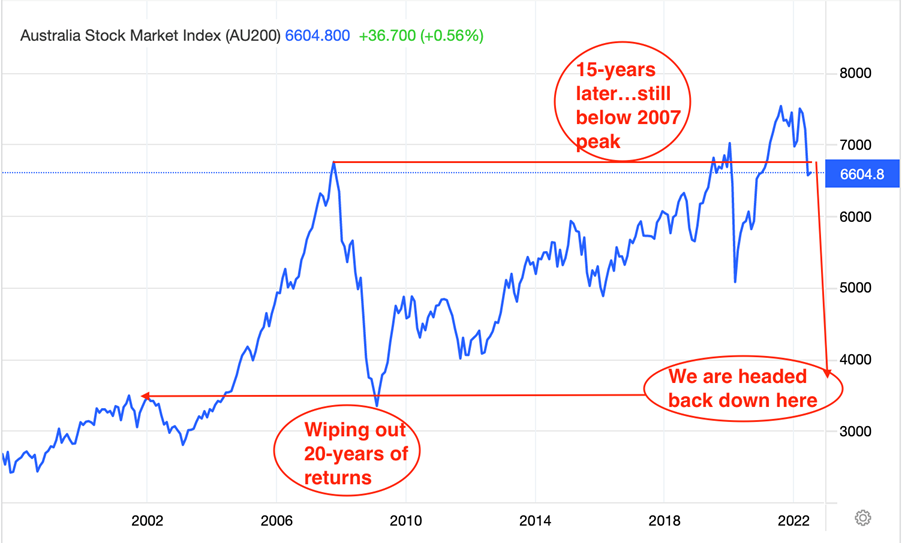
However, with the latest market downturn, the ASX 200 is now below its 2007 peak…almost 15 years later, and still, we wait for shares to go up in the long term.
And, if Wall Street falls as heavily as I suspect it will in the next 12–24 months, the ASX 200 is likely to go back to a level it first reached in the early 2000s…wiping out more than two decades of gains:
|
|
| Source: Trading Economics |
Why do I think the US market is going to fall hard?
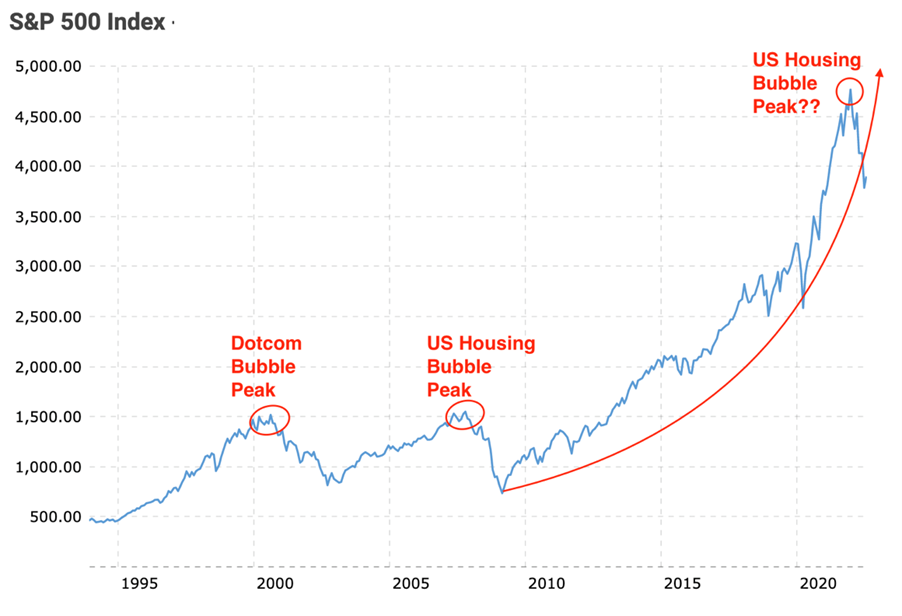
Because of my answer to this question: Can the S&P 500 Index continue rising ever upwards past its December 2021 peak, OR has the latest bubble peaked and a major trough awaits?
|
|
| Source: Macrotrends |
Markets ALWAYS move in cycles.
Therefore, as we saw in 2000/01 and 2008/09, we can expect the trend to reverse and stage a significant collapse…by my numbers; there’s another 60% downside still to come on the S&P 500 Index.
The ASX 200 is going to be caught in Wall Street’s downdraft.
In the midst of a boom, it can be difficult to appreciate the long-term cyclical nature of markets.
Understanding how long-term market cycles work — what the bull giveth, the bear taketh away — has never been more crucial.
The secular bear is just starting…don’t wait until it’s too late to realise the new reality investors now face.
Secular bull and bear
In an attempt to put an older head on younger shoulders, this is an edited extract from my book…How Much Bull Can Investors Bear?:
“Don’t become a mere recorder of facts, but try to penetrate the mystery of their origin.”
‘Ivan Pavlov
‘Even if you’re not the investing type, you should be familiar with ‘bull’ and ‘bear’ markets.
‘The mental image created is a bullraging ahead, while the bear claws the market down.
‘But very few people, even those in the investment industry, are familiar with, or admit to knowing about, the terms Secular Bull and Secular Bear markets.
‘In my 36 years in the investment business, I’ve never heard or seen these terms mentioned in any industry presentation or research.
‘We know from share market charts that, over the very long term (100-plus years), the market’s positive (bullish) periods have certainly outweighed the negative (bearish) ones.
‘Progress has been made with a pattern of “two steps forward and one step back”. The very long — 100-year term — trend is why there’s no disputing the statement: “In the long-term shares go up”.
‘There is just one small problem with this established belief — investors don’t have 100-year timeframes. The majority of people have investment horizons that stretch between 20 to 40 years.
‘Therefore, if you happen to be in the “one step back” period of the market’s progressive dance, it’s unlikely you are going to experience any significant uplift from the share market.
‘When viewed over a 20 to 40-year time frame, the share market is not always the clear winner you are led to believe it is.
‘This is an inconvenient fact the investment industry is either ignorant of or chooses to ignore.
‘The investment industry’s relevance is heavily tied to the fortunes of the share market. Therefore, all marketing efforts are built around reinforcing the belief that, in the long term, shares go up. Selective data is used to validate the marketing message. It’s this “cherry picked” data that enables the industry to perpetuate the myth.
‘The following graphs show you how the promoters can manipulate the message.
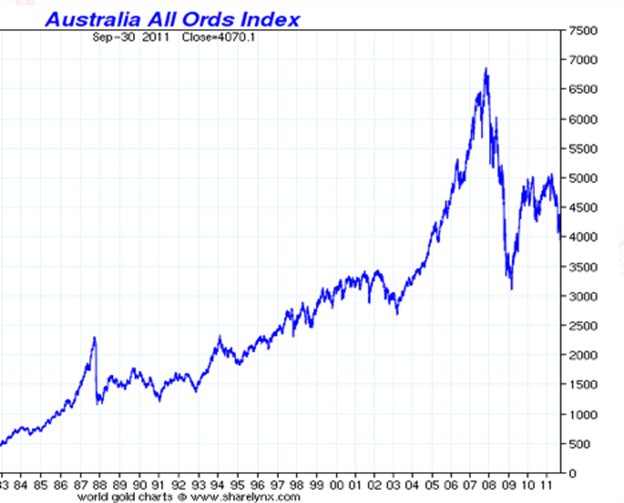
‘The first graph is the movement of the Australian share market (All Ordinaries Index) from 1983 to September 2011. This graph, like the CommSec graph in Chapter One, shows the market’s 15-fold increase over a 25-year period.
‘The trajectory wasn’t always smooth. The investment industry uses the bumps in the road — 1987 crash, mid-1990s Asian crisis, and 2000 “tech wreck” — to highlight the resilience of the share market, and to add credence to their claim of the share market always recovering to post new highs.
‘To the average investor, this certainly appears to validate and reinforce the belief that, in the long term, markets go up.
|
|
| Source: sharelynx.com |
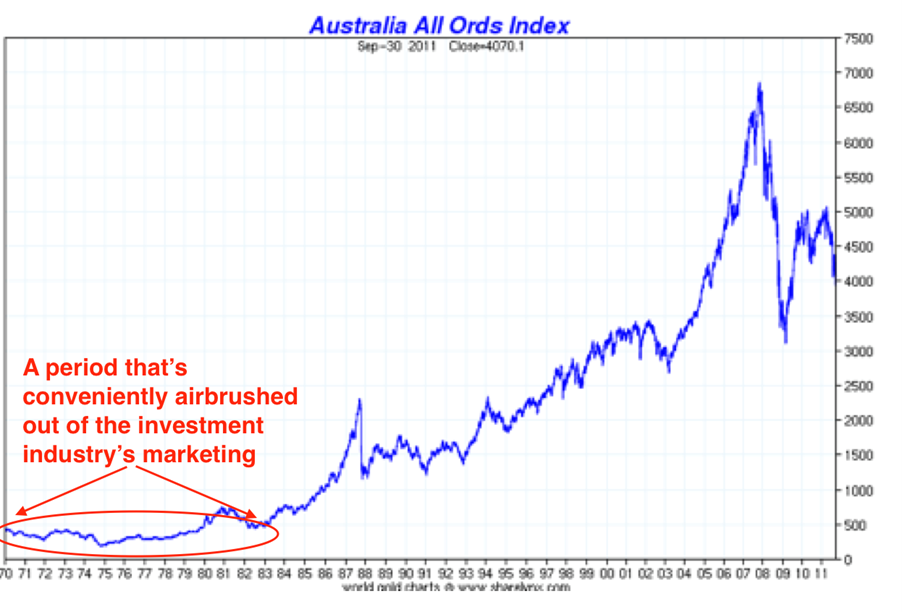
‘The second chart (below) is an extended version of the above chart.
‘The difference is the next chart goes back to 1970. You can see the 13-year period prior to 1983 was a vastly different experience for share market investors. There was no 15-fold increase; in fact, there was barely any increase at all.
‘During the 1970s and early 1980s, interest rates rose from 3% to over 16%. Gold soared from US$35 per ounce to over US$800 per ounce. While all this action was going on in other assets classes, shares were running up and down on the spot, struggling to maintain their relevance in investor portfolios.
‘This rather dire period in the market’s history is conveniently airbrushed out of the industry’s marketing efforts. Every share market graph I’ve seen from the industry starts in the early 1980s.
|
|
‘These two distinct periods in the history of the share market are known as Secular Bear and Secular Bull markets.
‘Secular is another way of saying “long-term trend”.
‘For example, if we look at the 1982–2007 period, there’s a clear long-term rising trend — known as a Secular Bull market.
‘Falling inflation rates, rising levels of debt-fuelled consumption, falling interest rates, baby boomers’ consumption, low oil prices and the introduction of technology all drove this trend of higher share prices.
‘However, the rising trend was not without its hiccups. There were short-term bear markets — the most notable setbacks being the 1987 “crash” and the 2000 “tech wreck”.
‘In broad terms, the All Ords’ progress during the Secular Bull market can be best described as “three steps forward and one step back”.
‘A close inspection of the 1970–82 Secular Bear market (the Secular Bear market actually commenced in the late 1960s) shows the market also had times when it moved in an upward (bullish) trend, only to surrender those temporary gains to the negative trend.
‘Unlike the progressive dance of the Secular Bull market, the Secular Bear market’s movement is more regressive — “one step back, one step forward and one step back”.
‘No real positive momentum is achieved.
‘You may be thinking, “Does one flat period in the Australian share market really prove anything?”
‘To answer that question, we can examine the abundance of data available from the largest share market in the world…the United States.
‘The data verifies the existence of Secular Bull and Bear market cycles over the very long term.
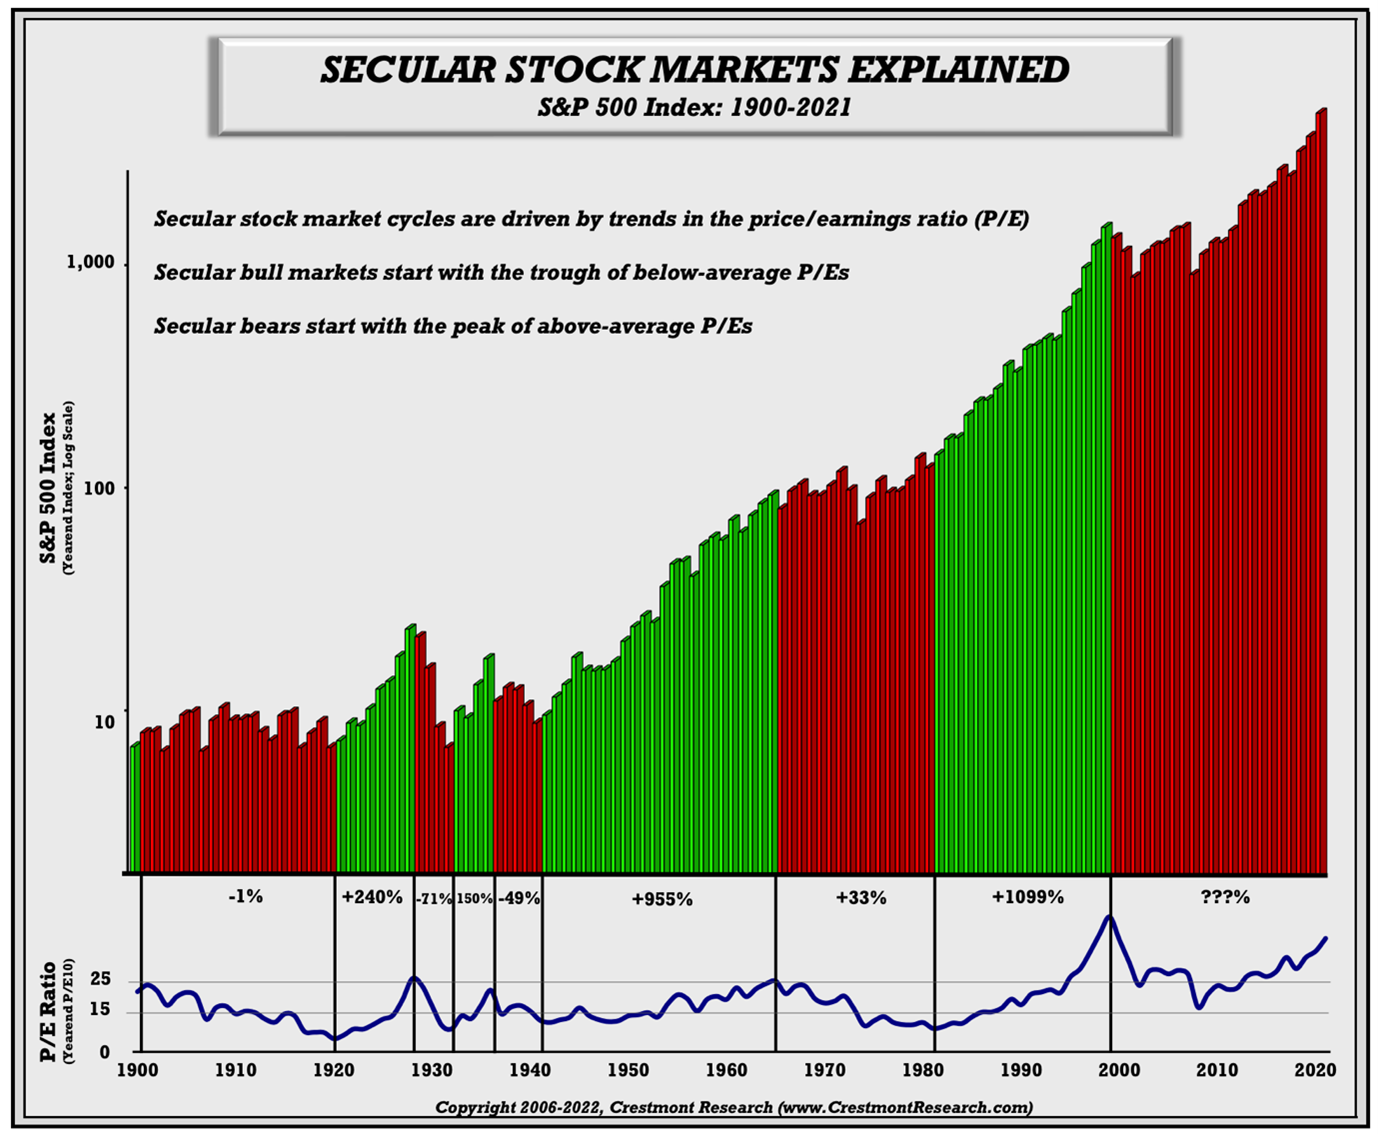
‘The following graph of the S&P 500 Index, courtesy of Crestmont Research, dates back to 1900.
‘The green areas represent Secular Bull markets, whereas the red areas represent Secular Bear markets. Beneath each section is the rate of return achieved in the relevant period:
|
|
‘In nominal terms (without adjusting for inflation), the 1,099% return during the 1982 to 2000 Secular Bull market was by far the most rewarding period of performance in the US market’s history.
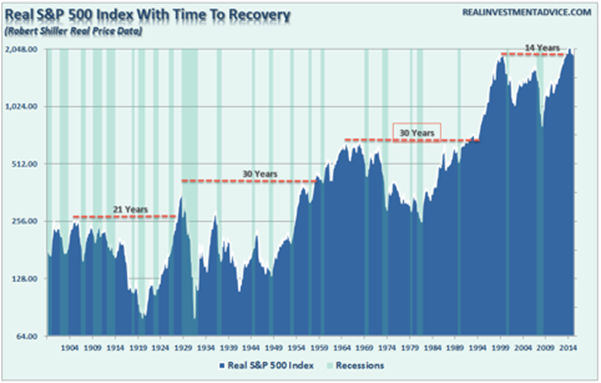
‘The following graph is a chart of the Real S&P Index (adjusted for inflation) indicating the time periods taken to recover from peak to peak.
|
|
| Source: Real Investment Advice |
‘The pattern is similar…extended periods of advancement and retracement.
‘Even in inflation adjusted terms, it is evident that the period of performance from 1982 to 2000 was exceptional.
‘If you subscribe to the principle that, for every action, there is an equal and opposite reaction, the obvious question is: Will the best performing period in market history now be followed by the worst performing period in history?’
My answer to the above question is an unequivocal…‘Yes’.
If my answer proves to be — even somewhat — correct, then those who believe ‘shares go up in the long term’ are going to be much, much, much older before this industry ‘truism’ delivers on its promise.
And, those much older heads, in maybe 2040 or later, will try in vain to transplant the wisdom they gained at great cost, onto younger shoulders.
Cycles always repeat.
Regards,
 |
Vern Gowdie,
Editor, The Daily Reckoning Australia
