



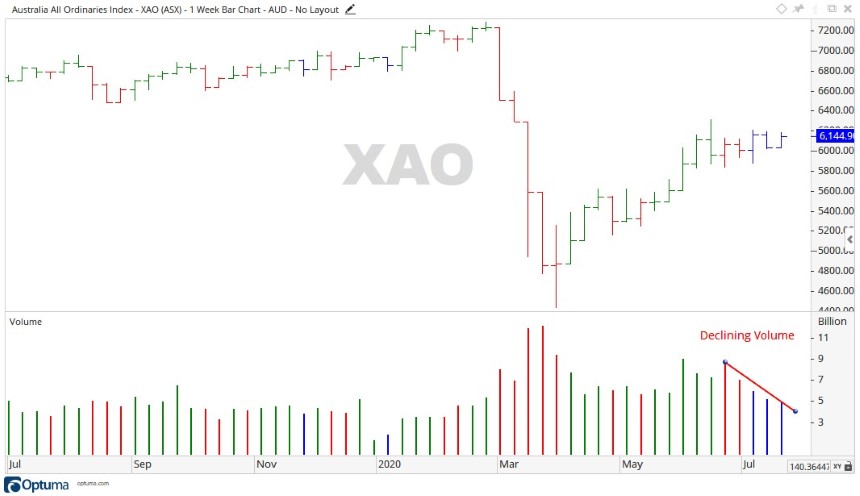
Last week saw the All Ordinaries [XAO] move sideways again as it gained 160 points. Closing out the week at 6,144 points, the market lacked the momentum to break through the high of the previous week.
Much like the week prior, last week’s move took place on declining volume, a shaky indicator for a stronger move up.
Source: Optuma
ASX Outlook for the week ahead
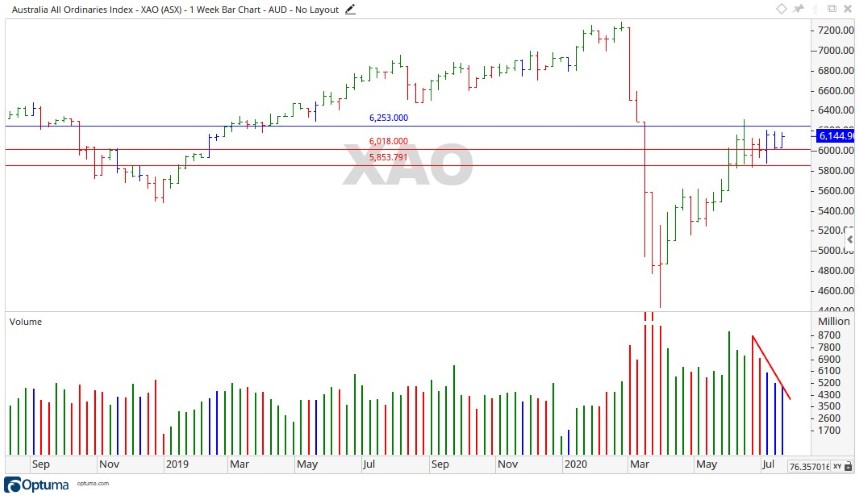
With the All Ordinaries [XAO] unable to create a new high the last week, the outlook for the ASX this coming week looks to be more of the same as the market sets into a sideways movement for the time being.
Holding the same expectation as last week for the market to look bullish, the first level that needs to be broken is 6,253 points.
On the downside, to be sure of a falling market price it would have to break the levels of 6,018 first, then 5,853 points.
The market will pick a direction soon enough, right now we must wait.
Source: Optuma
A Closer look at the All Ords
Most of the market either moved sideways or a lot of stocks closed relatively close to their open for the week.
In the sectors, Financials and Materials recorded a positive week, moving up 2.07% and 4.20%, with industrials also up 2.33%.
Information Technology pulled back 3.58% and Healthcare closed on its open.
Moving down into the stocks, Alumina Ltd [ASX:AWC] recorded a strong week, up 12.85%. Credit Corp Group Ltd [ASX:CCP], and Fortescue Metals Group Ltd [ASX:FMG] also posted gains of 10.81% and 10.37%.
On the downside, Ardent Leisure Group Ltd [ASX:ALG] fell back 5.40% along with FlexiGroup Ltd [ASX:FXL] and Altium Ltd [ASX:ALL] also declining 4.72% and 4.22%.
A broader outlook for the XAO
This year is proving to be one for the record books. The COVID-19 pandemic is roaring along, there looks to be a lot of political instability around the globe, people are losing their jobs, and society is changing.
While this all may seem very new to us, to history it isn’t. In the course of human history, we have seen the lot.
War, famine, sickness, health, prosperity, and more. If you can name it, someone in the course of history has probably been through it. Not only been through it, but also recorded and tried to understand it.
As the old saying goes…‘there is nothing new under the sun’. Which brings me to the Elliott wave principle.
In the 1920s, a man named Ralph Nelson Elliott became very ill and bed ridden after travelling to Central America, with not much to occupy his time he dedicated himself to analysing the stock market indices for the time.
Through this study he developed his wave theory for predicting market trends. With nothing new under the sun, it holds true that the discoveries Mr Elliott made in the ‘20s can still be used today to predict future trends.
A basic summary of the theory is 5 impulsive waves up —within that 5, two will be corrective waves.
At the end of wave 5, there are three corrective waves down — one of those being an impulse wave.
1,2,3,4,5 up.
A,B,C down.
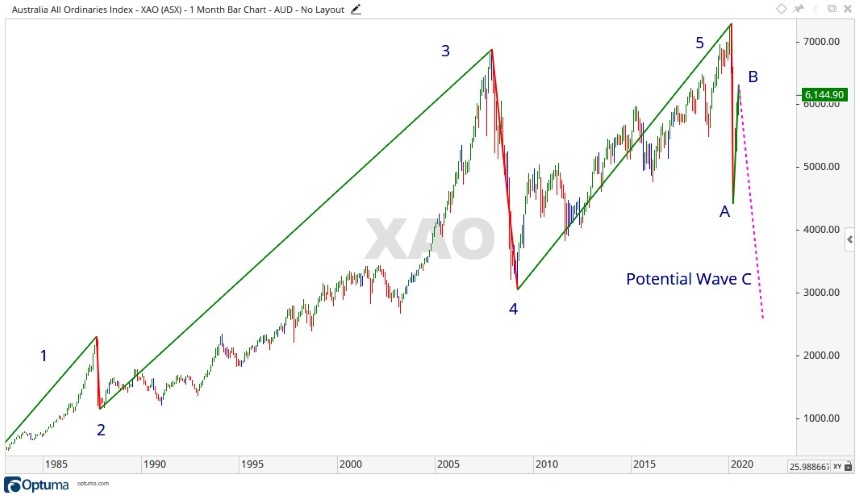
This can be applied today to gauge where the All Ords may be heading. By looking at the chart below and taking a long-term view, the theory can be applied.
Source: Optuma
Moving through the 5 impulse waves to the high of 7,289 points in February 2020, the market fell away with the emergence of the pandemic.
Prices fell away sharply into March with a low of 5,110 points, then bouncing up into June to a high of 6,314.
If this sequence is to be true and with the All Ords moving sideways over the last few weeks, is the market about to move down into a long-term wave C?
With the market yet to pick a direction, the best thing to do might just be wait and watch.
Regards,
Carl Wittkopp,
For Money Morning
PS: Four Well-Positioned Small-Cap Stocks – These innovative Aussie companies are well placed to capitalise on post-lockdown megatrends. Click here to learn more.



Comments