

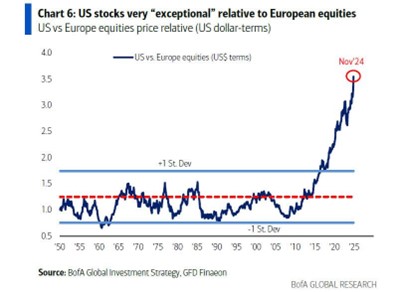
The US stock market has utterly dominated its peers around the world for a decade. In fact, the surge in US share prices has left other major markets for dead. It’s difficult to overemphasise just how big the gap in performance has grown over time.
This chart shows how the returns on US stocks have blown out to absurd levels relative to European shares.
| |
| Source: BofA Global Research |
From July 2014 to June 2024 the US-focused Vanguard Total Stock Market Index (VTSMX) returned 12.0% per year. The non-US focused Vanguard Developed Markets Index (VTMGX) returned just 4.6%. That’s a staggering difference of 7.4% per year, with US stocks rising 1.6 times faster!
Not only is the outperformance vast, it has been surprisingly plain sailing along the way. State Street Global Advisors calculated that US stocks have been a better bet for a record 134 consecutive months.
Adjust for exchange rates and that rises to 180. “In fact, every rolling 10-year period from 2013 onward has favored US equity markets,” State Street concluded.
The same goes for every single developed country you might compare the US stock market performance to.
This extreme outperformance of one country’s stock market has caused some bizarre statistics to start popping up.
For example, you can compare the value of the companies in the US’ S&P500 index to the size of the global stock market combined. The US’ share of global market cap has risen from around 35% in the 1990s to more than 70% today! Next highest is Japan, at around 6%. Australia’s market comes in at 2%.
| |
| Source: Crescat Capital LLC |

| |
| Source: Crescat Capital LLC |

All this is extraordinary. But what makes it all the more remarkable is how it happened.
Why are American profits worth more?
If US companies had performed better in terms of profits or dividends, it would make sense for them to outperform on the stock market too. Then American shares would’ve been worth more objectively speaking.
But the financial data firm Morningstar pointed out that it wasn’t really company profits driving the divergence. Past and expected future profits are not that different compared to other developed countries’ stock markets:
‘The long-term historical earnings growth (past five years) of foreign developed-markets stocks did trail that of US stocks. However, the difference was minor: 5.5% versus 6.3%.
‘And while analyst expectations for future earnings growth (three to five years) also favored US stocks, it was also only by a relatively small amount: 11.7% versus 10.7%.
‘Such small differences cannot explain the dramatic outperformance of US stocks. In other words, US stocks’ outperformance is mostly explained by rising valuations.’
This means investors were willing to pay more for the same profits in the US than elsewhere. They bid up the price of equivalent stocks to much higher levels in the US, making them expensive relative to their value.
Measures of such valuations have reached extreme levels in the US, while remaining suppressed elsewhere. Morningstar summarised the gap in valuations:
- Price/earnings ratio of US stocks was 52% higher
- Price/book was 131% higher,
- Price/sales was 85% higher
- Price/cash flow was 57% higher
So investors are paying vastly higher prices for the same pound of profits in the US than in Europe, Japan and Australia. The same for accounting values, sales revenue and cash on the balance sheets too.
Most absurd of all, the dividend/price ratio of foreign developed-markets stocks was 120% higher. This means investors value US dividends 120% more than non-US dividends.
This sort of divergence should not occur. It’s absurd for a dollar of profit or dividend to have a dramatically higher price in the US than outside it.
Mean reversion is not known for its kindness
Historically speaking, expensive stocks tend to underperform while cheap ones outperform. That’s the basic premise of value investing – Warren Buffett’s famous methodology. You should buy what’s cheap and sell what’s expensive.
This implies that non-US developed market stocks, like ours in Australia, should dramatically outperform US stocks in coming years. Probably by way of a plunge in the value of US stocks.
To put it bluntly, the easiest way to crash a stock market is to bid it up into a bubble first. Like Icarus and tall poppies, they eventually fall.Investment strategist Albert Edwards put it like this:
‘This is getting silly. US share of MSCI world index is circa 75% […]. But old hands will remember the late 1980s when Japan was circa 50% of the world index. Japanese companies and especially banks dominated the world. No-one could conceive it would end, but it did.’
Japan’s stock market bubble burst in dramatic fashion, to say the least. It’s rude to even mention stocks here in Japan. Because so many people committed suicide when their investments crashed in the 90s. I found that out the hard way…
But every time investors around the world bet on a return to normality by selling their American shares and buying non-US stocks, the gap just grew even more.
As The Economist magazine asked, ‘Should investors just give up on stocks outside America? No, but it’s getting a lot harder to keep the faith’.
And that’s not the only aberration in the stock market right now…
The Mag7 are just as dominant
Did you know just seven stocks were behind the American market’s extraordinary outperformance? They’ve become known as the Magnificent 7, named after my grandfather’s favourite film. And I suspect the stocks face the same fate as the characters in the film.
They are…
- Alphabet, the parent company of Google
- Amazon, the online retailer
- Apple, the gadget company
- Meta, the parent company of Facebook
- Microsoft, the software company
- Nvidia, the computer chip manufacturer
- Tesla, the electric car company
These seven companies generated annual returns of more than 20% since 2010, double the other companies S&P 500. In some years, the Magnificent 7 were the only thing keeping the broader US stock market index in the green.
Together, the Mag7’s value was about the same as the entire stock market of the UK, Canada and Japan combined. Their combined profits are more than almost every G20 country.
They also account for much of the frightening overvaluation of US stocks. The S&P500’s ten biggest companies have a media P/E ratio of 30, meaning that investors are paying $30 per $1 of annual profit. The rest of the S&P500’s companies have a median P/E of just 19, making them much cheaper. In fact, it’s only a little higher than European stocks at 16 and ASX200 stocks at 18.
As you’ve probably noticed, the Magnificent 7 stocks are all rather similar. They are the pride of America’s tech sector in one way or another.
That’s why the S&P500’s tech sector is outperforming the rest of the index by the most since the tech bubble of 2000. Which means the US market’s outperformance was also concentrated into one particular industry.
We can sum it up like this: what looks like an impressive American stock market boom is really just a surge in a select few global tech conglomerates.
All this is a stark reminder that you have to be in the right place at the right time and in the right companies in order to succeed in investing. A narrow sector of the market in just one country can define the returns of even a well-diversified portfolio.
Of course, a portfolio that is concentrated in the right stocks should outperform.
So, the question is, where could this decisive sector be in 2025? Find out more here.
Reversion to the mean will strike back…eventually
It’s unlikely the US stock market and its Magnificent 7 can sustain their outperformance much longer. What goes up must come down and one sector of the market cannot leave all others behind indefinitely. That was true of Japan in the ’90s, tech stocks in 1999 and countless other bubbles.
At some point, reversion to the mean must kick in as investors go shopping in cheaper markets outside the US. They’ll get more bang for their buck in terms of dividends and profits, which should define long-term returns.
So, the big question all investors face today is simple: where are the next Magnificent Seven? And what could they be?
Regards,
 |
Nick Hubble,
Editor, Strategic Intelligence Australia

Comments