Depressions are never fun.
But the Great Depression of the 1930s, known as the worst economic downturn in modern history, was on a whole different level that’s inconceivable today.
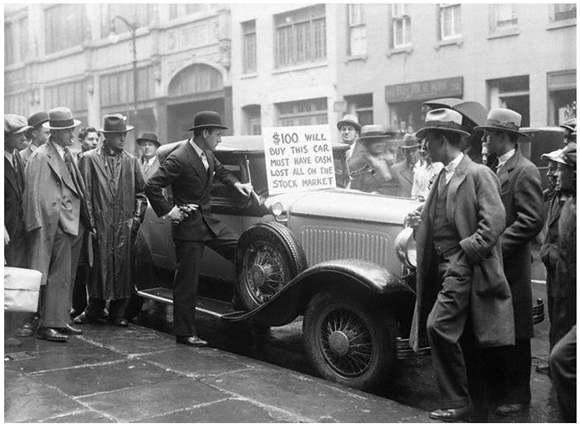
People lost their jobs, were evicted from their homes, and many ended up on the streets.
First-hand accounts describe the utter devastation of those years:
‘Have you ever seen a child with rickets? Shaking as with palsy.
‘No proteins, no milk.
‘And the companies pouring milk into gutters.
‘People with nothing to wear, and they were plowing up cotton.
‘People with nothing to eat, and they killed the pigs.
‘If that wasn’t the craziest system in the world, could you imagine anything more idiotic?
‘This was just insane.
‘And people blamed themselves, not the system.
‘They felt they had been at fault:
“If we hadn’t bought that old radio…”
“If we hadn’t bought that old second-hand car.”
‘Among the things that horrified me were the preachers — the fundamentalists.
‘They would tell the people they suffered because of their sins.
‘And the people believed it. God was punishing them.
‘Their children were starving because of their sins…’
– Civil rights activist, Virginia Foster Durr
facinghistory.org
|
|
| Source: Twitter @TickerHistory |
Despite the economic gloom of the day, however, one loan voice was forecasting a boom.
His name was Roy Wenzlick (1894–1988).
He was a US real estate valuer and economist.
He wrote The Coming Boom in Real Estate and What to Do About It in 1936.
In it, Wenzlick lays out his arguments for a peak in real estate activity between 1943 and 1945, before the next low point in 1955:
‘Every real estate boom in the history of this nation had passed through the same stages in the same sequence.
‘The coming boom will be no exception…
‘…large contractors will do well, and owners of office buildings will again realize handsome returns on their investments.
‘When this stage arrives, the boom will have reached its crest…
‘When will it arrive? Probably not until 1943 or 1944.’
It was a controversial call…but it happened.
The US and UK real estate markets roared in the 1940s post-war boom. Before both countries slid into recession in the mid-1950s and prices reverted.
It played out just as Wenzlick’s analysis had shown.
From The Guardian archive, 1947, ‘A year of soaring house prices’:
‘Prices at which these have changed hands have not shown a proportionate increase, but those of the smaller type “semi-detached” have more than doubled and anything up to £1,500 is being asked and obtained for houses which went for £500 or £600 in 1939.
‘“It seems impossible to acquire a house of any kind at less than double its 1939 value,” said the authority quoted…’
Wenzlick’s book sold more than 100,000 copies in its first year of publication.
It made The New York Times best seller list, alongside titles such as Gone with the Wind.
When it was republished 34 years later, in January 1970, the Greater Portland Commerce described it as:
‘Coming Boom in Real Estate, published in 1936 and reprinted in the Readers Digest, was such an accurate forecast that it was reprinted 25 years later without changing a single word.’
Few are aware of Wenzlick, his work, or his contribution to the study of the 18-year real estate cycle.
That’s not surprising.
Unlike Homer Hoyt, credited for ‘discovering’ the land cycle in his thesis, 100 Years of Land Values in Chicago, and renowned for his pioneering work in land use planning, zoning, and real estate economics, Wenzlick could almost go unnoticed.
He doesn’t have a Wikipedia page.
His tremendous body of work (spanning from the 1930s to his retirement in 1974) is not openly available online.
Despite being a best seller and having been reprinted numerous times, his 1936 book, The Coming Boom in Real Estate… is incredibly hard to get hold of.
You won’t find a copy of the text in the public sphere.
You won’t find it with an internet search.
And you won’t be able to purchase old or reprinted copies off Amazon or the like.
Still, for any serious student of the real estate cycle, knowledge of Wenzlick, his work, methodology, and forecasts are essential if you want to forecast the future accurately.
Roy Wenzlick had a head start.
He was born into real estate.
His father, Albert, was the head of Albert Wenzlick Real Estate in St Louis.
He worked in the family business from a young age, collecting real estate data and learning the trade.
In 1928, he founded the Roy Wenzlick Research Corporation Inc.
In 1932, the company started publishing the Real Estate Analyst with Roy Wenzlick as editor and publisher.
It was the only national statistical forecasting service on real estate when it began, and the research was groundbreaking.
Bear in mind that before 1970, there were no digital records or a central database of sales information such as we have today from data agencies like CoreLogic and Domain.
Data had to be collected from real estate firms, newspapers, local governments, etc. It was a laborious task.
Wenzlick was one of the first, if not the first, pioneer in this field to collect this data and attempt to forecast the future.
Banks, insurance companies, and other interested parties employed him to value real estate.
Still, his great passion was economic forecasting:
‘When I started accumulating data on urban real estate in 1928 it was, insofar as I know, the first attempt in the world to undertake this type of real estate research on a commercial basis.
‘In the 38 years that have elapsed since then I have accumulated vast amounts of information in an attempt to reduce rough and inaccurate descriptive terms to quantitative measures.
‘I have been primarily interested in studying fluctuations in the past, and in answers to the questions of, “how much?”, “how long?”, and “why?”
‘The field is so large, however, that sometimes I feel I have only scratched the surface, but I have considerable confidence in research techniques and in the cumulative value of measured data.
‘It seems to me that real estate forecasting should constantly become more accurate and reliable…’
Inflation and Real Estate (1966)
by Roy Wenzlick
I’m not so sure forecasting has become more accurate. The mainstream misses the mark commonly.
But considering we stand on the shoulders of masters from the past, it should be!
As mentioned above, in 1936, he published The Coming Boom in Real Estate…and made The New York Times best seller list.
As he had predicted in his book, when the boom happened, he became a national real estate investment authority.
He was called upon to give numerous media interviews, newspaper articles, and speeches.
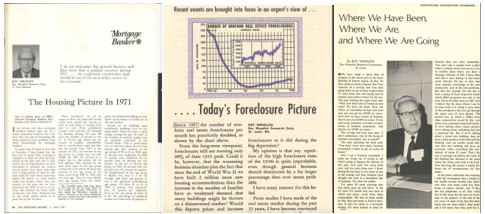
|
|
| Source: The State Historical Society of Missouri |
He received a PhD in Economics from Saint Louis University in 1942.
The Wenzlick Research Corp. conducted a whopping 475,000 appraisals, site surveys, and more than 60 reports on major redevelopment projects across the US.
Wenzlick’s company also created appraisal manuals used in more than 1,600 communities.
He was an exciting and experienced speaker.
Over the years, he gave hundreds of talks at colleges, conventions, and business meetings across the country.
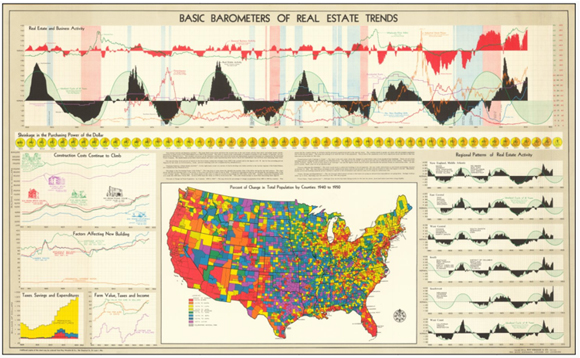
He used giant copies of his numerous charts and maps to demonstrate the trends in real estate and all the factors that affected such trends.
Here’s a screenshot of a couple below:
|
|
| Source: Basic Barometers of Real Estate Trends (1951) Wenzlick & Co. (copy of print edition held in Milwaukee County Library) |
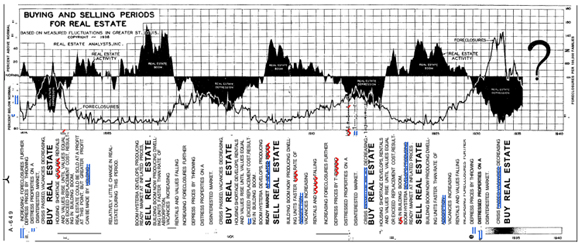
Here’s another chart:
|
|
| Source: The Coming Boom in Real Estate and |
The chart above identifies the boom in real estate values leading into 1872, 1890, 1906, and the 1920s.
The lows occurred in 1878, 1900, 1918, and 1933. Giving credence to a cycle that, on average, lasted 18 years.
I’ve shared many excerpts from my own library of Wenzlick’s publications with subscribers to Cycles, Trends & Forecasts, so I cannot go into too much detail here.
However, one thing we can be sure of is that Wenzlick wouldn’t be looking at today’s market through the one-eyed lens of interest rates alone — as many economists continue to do.
To really understand what is occurring in the market, it’s necessary to have knowledge of the longer 18-year cycle in real estate — and understand why and how it repeats in the same pattern, the same sequence — over and over.
Here’s what Wenzlick had to say about the importance of studying history when it comes to the real estate cycle:
‘Few men under fifty today have been in business long enough to have experienced more than one general real estate boom.
‘Unless a man has been in business for seventeen years, he did not experience the beginning of the last real estate boom.
‘The length of the real estate cycle, therefore, makes it necessary to supplement the relatively short experience of the individual with an historical knowledge of the causes and effects in previous cycles, with the danger signs, with the sequence of events in the depressions and recoveries, and with such other material as will aid in making his real estate investments with the least risk and the maximum profit.
‘In order to acquire such knowledge, we have compiled figures month by month on all factors affecting real estate from the Civil War to the present.
‘These studies started in St. Louis.
‘They have now been ex tended to cover all of the principal cities in the United States.
‘The advices…are not armchair philosophies drawn from the cogitations of a superintelligence turned in upon itself.
‘They are the common sense interpretations of hundreds of charts and studies showing real estate fluctuations and their causes in these periods in the past.
‘We believe that any one with average intelligence would have reached the same conclusions from the same studies.’
Wenzlick was right.
Any man or woman with common intelligence could learn to navigate the market when they studied it through a historical lens.
It’s why so many economic forecasts fail today.
And it’s why we haven’t seen and won’t see the 15–25% drops in the national median — yet.
Rents and prices have risen rapidly over recent years.
And although increases in the cash rate have curtailed the market — buyers fearful over rising costs — supply/demand factors are still very much at play.
Rental listings in Sydney and Melbourne are continuing to fall at a time when demand is soaring.
The situation will inevitably be further strained with the Albanese Government pushing immigration to record levels.
There’s no sign of a significant lift in rental supply to ease demand either.
Multiple major construction firms have collapsed due to the cost of building materials and labour shortages.
If Wenzlick were looking at the market forces today — he wouldn’t be forecasting a crash — despite rising rates and the dollar’s purchasing power diminishing.
The truth is if Wenzlick were around today, he would be forecasting a boom in the 2–3 years ahead of the peak of this cycle.
The trends impacting supply/demand so dramatically need to reverse to see significant changes.
Over to Wenzlick:
‘…the fact that over a long period real estate, like other commodities, is affected by replacement cost means that over the long period the primary factors which will determine the market are those which influence the value of money.
‘If we are in a deflationary period, replacement costs will drop and values will drop.
‘If we are in an inflationary period, as we think we are, replacement costs will increase as they have been increasing, and eventually the values of existing properties will rise, taking on at least a percentage of the increase in replacement costs.’
Here Wenzlick gives valuable information about one of the reasons real estate prices can continue to rise in times of increasing inflation.
And he does it with a historical outlook:
‘If I would forecast, then, the selling prices of existing single-family residences during the next 10 years, I would focus my attention primarily on the probable level of replacement cost during this period.
‘Clearly, the reason why the values of existing buildings practically doubled from 1914 to 1926 was the fact that the cost of building a new building on a suitable lot during this period practically doubled.
‘The reason why the average residence increased from $5, 500 in 1940 to $18,000 in 1958 was that replacement cost of a somewhat similar building increased from $8,000 in 1938 to almost $22,000 in 1958.
‘The drop in the selling prices of existing houses from 1958 through 1963 was due primarily to the fact that we were building houses faster than they were being occupied, with a corresponding increase in vacancy…’
Putting this into the context of today’s market.
You may have read anecdotal reports in recent times that existing properties that require no renovation or major work are the ones attracting competition.
Others that need substantial renovation works, or sites prime for development, sit on the market for extended periods.
When the cost of building materials and labour increases, the trends that drive up prices of well-maintained existing properties will override others.
Especially in an environment with record-low unemployment, population growth in city markets are strengthening.
It means that right now, the supply/demand dynamics of the market will continue to underpin prices and likely produce a sustained turn by the second half of this year.
If we see a pause or cut to the cash rate in months ahead following some countries falling into recession, then the trend is going to be exacerbated.
All in all, I still maintain that we have a few more years left to run in this cycle until we reach a peak around 2026.
The analysis is against a backdrop of history.
In later writings Wenzlick wrote:
‘Thirty-eight years ago, I pointed out in the Real Estate Analyst (1936) that real estate had followed a long cycle which I later determined to average 18 1/3 years.
‘When charted from 1795 to the date of publication it was rather remarkable that the booms and depressions in real estate as measured by the relationship of the number of families had followed a rather consistent pattern of booms and depressions.
‘I never indicated that in each real estate cycle the booms and depressions that followed would equal exactly 18 1/3 years.
‘Some were slightly longer, and some were shorter.‘But the average length from the peak of one boom to the peak of another, and from the bottom of one depression to the bottom of the next, averaged out at 18 1/3 years.’
If you want to find if and how this cycle applies to Australia, take a deep dive into the economic patterns and human behaviour that assures it will continue to repeat, as well as learn how you can best take advantage of the wealth-building opportunities ahead — consider subscribing to my property investment service, Cycles, Trends & Forecasts today.
Best Wishes,
 |
Catherine Cashmore,
Editor, Land Cycle Investor


