
Friendly warning…today’s The Daily Reckoning Australia is long on charts and short on text.
These pictures paint more than a thousand words. However, there’s only ONE message from today’s issue and that is…history repeats and now is the time to exercise extreme caution.
In 2006, while the US Housing Bubble was in full inflating mode, Dr Jean-Paul Rodrigue studied bubbles and manias past to formulate this all-too-repeatable pattern of human behaviour.
|
|
| Source: Dr. Jean-Paul Rodrigue |
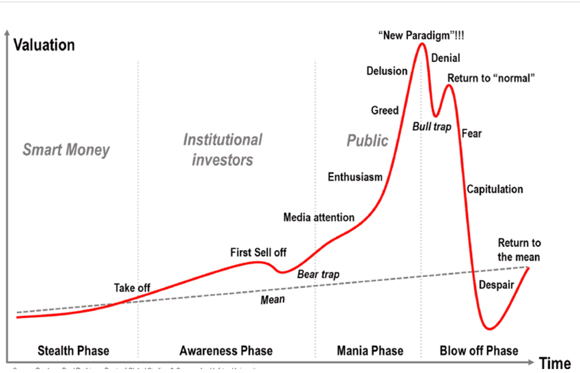
In a detached state of mind, we can rub our chins, nod our heads and think ‘yes, this represents a fair and rational assessment of man’s evolving emotional states’.
Yet, when we’re in the middle of it all and markets are playing mind games, it’s not easy to remain so composed. Patterns get repeated — time and time again — because, at our core, we are emotional beings. Amidst the racket of fear and greed, voices of reason are invariably drowned out.
There is much whoopin’ and a hollerin’ over a new bull market on Wall Street.
Yes, in technical terms, the S&P 500 Index does meet the 20% recovery definition of a ‘new’ bull market.
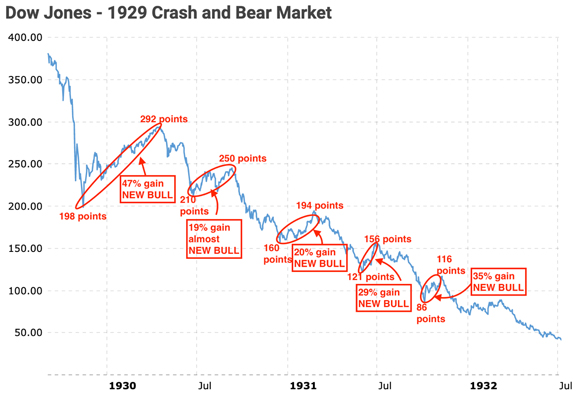
But, as I showed in last week’s issue of The Gowdie Advisory, there were no less than four —and almost five — so-called ‘new bull markets’ in the Dow’s near 90% plunge between 1929 and 1932.
|
|
| Source: Macro Trends |
Wall Street fortunes rest on one skinny pillar
The reality is, there’s genuine bull markets and there are fake bull markets.
The latter are ones where only a handful of stocks push the headline indices higher.
As of 20 June 2023, the year-to-date (YTD) performance of the S&P 500 Index was 15.24%. However, this performance has been entirely due to the Magnificent Seven.
|
|
| Source: CMG |
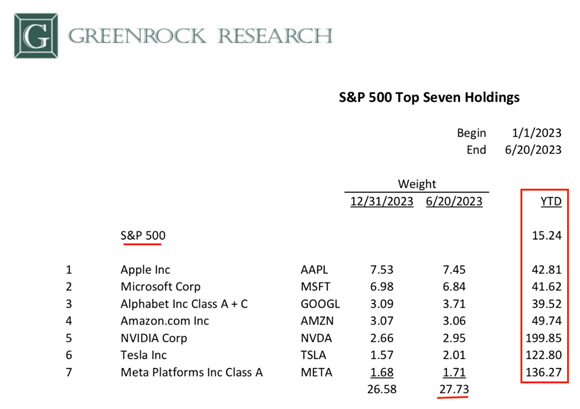
The ‘Top Seven Holdings’ (which account for around 28% of the S&P 500) have shot the lights out.
Without the performance of these seven stocks, the remaining 493 stocks have turned in a performance of NEGATIVE 3%.
The broader market being supported by ‘one, very skinny pillar’ of support, is not a new phenomenon.
Thanks to human nature, there is market precedent.
According to Kevin Malone of Greenrock Research, ‘… in 1999, it was the top six stocks. You may remember that this was followed by a stock market that declined for the following three years…’
We saw the same thing 50 years ago
The early 1970s version of The Magnificent Seven, was called The Nifty Fifty.
As reported by USA Today (emphasis added):
‘The Nifty Fifty captivated investors for the better part of a decade prior to its demise in 1973, but not before reviving the high-risk investing that had been out of vogue since the Crash of ‘29.
‘That optimism was visible in a key measure of the stocks’ value: the price-to-earnings ratio or P/E — the price-per-share divided by the company’s annual earnings-per-share. By 1972 when the S&P 500 Index’s P/E stood at a then lofty 19, the Nifty Fifty’s average P/E was more than twice that at 42. Among the most inflated were Polaroid with a P/E of 91; McDonald’s, 86; Walt Disney, 82; and Avon Products, 65.
‘Along came the stock market collapse of 1973–74, where the Dow Jones Industrial Average fell 45% in just two years.’
While the broader index fell 45%, this is what happened to some of the higher profile ‘Nifty Fifty’…they suffered a greater level of loss…
|
|
| Source: Hussman Funds |
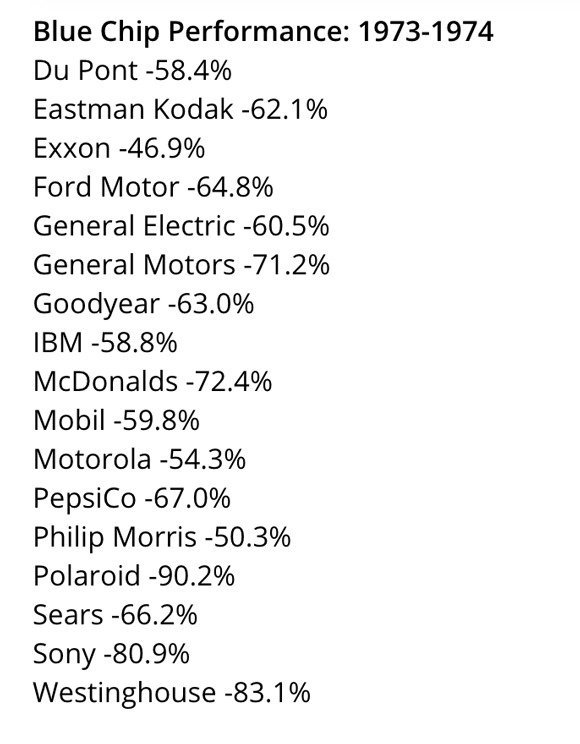
The fate of The Nifty Fifty is proof of ‘the higher you fly, the harder you fall’.
And, 27 years later, it happened again
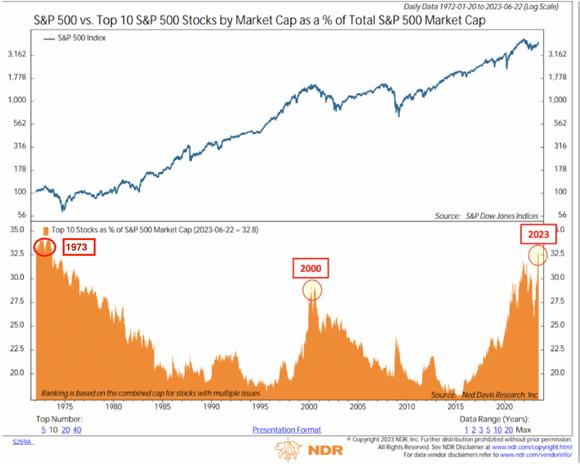
The pattern of infatuation with a handful of market darlings comes more clearly into focus with this next chart…‘Top 10 Stocks by Market Cap of S&P 500’.
It happened in 1973, and we’ve shown how that ended.
Then, 27 years later, it made its presence felt once more.
Investors got swept up in the ‘you can’t go wrong buying’ frenzy.
What had gone up by 100% or 200% in a relatively short space of time, would continue to do so.
No. No. No. That’s not how it works.
The fate suffered by the Nifty Fifty was repeated in the Dotcom Bubble Bust…
|
|
| Source: NDR |
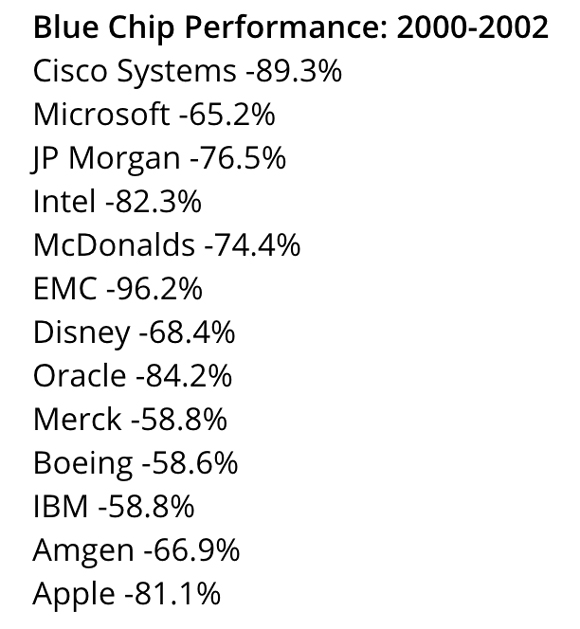
Here’s how the household names of the dotcom era performed during the bubble deflation period…the whooshing sound you can hear is the air coming out of the bubble pricing afforded to these ‘market darlings’…
|
|
| Source: Hussman Funds |
OK. OK. I know it’s different this time.
People are wiser and won’t make the same mistakes.
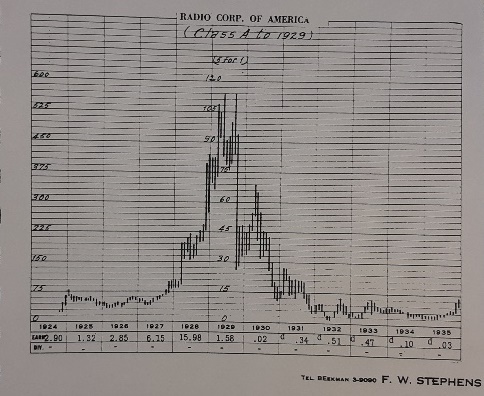
AI is going to be the big gamechanger…sounds just like what they said about radio in 1929.
But that overhyped narrative didn’t stop RCA (Radio Corporation of America) from falling in price from US$549 to US$15 in 1932…an unbelievable (and, in mid-1929, an inconceivable) 97% loss of value.
|
|
| Source: Twitter |
Which brings us to this bubble’s next big thing…
Nvidia…has the look and feel of 1929 and 1987
Amongst the Magnificent Seven’s stellar 2023 performance, Nvidia’s has been the real headline grabber.
Up almost 200%…that’s also unbelievable.
A large chunk of AI manic has been channelled into this one stock.
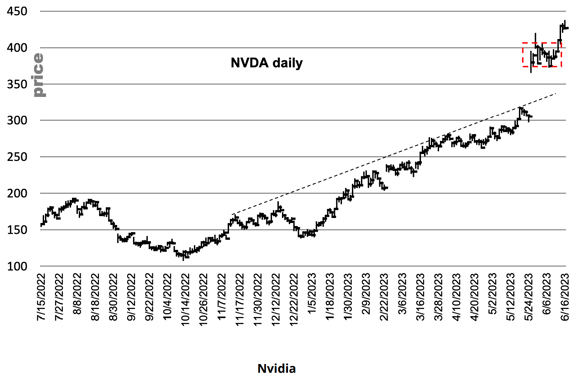
This next chart, courtesy of Momentum Structural Analysis (MSA), shows how the share price of Nvidia was in a steady uptrend, then POW, it broke out into ‘distribution range’ (red box).
According to Michael Oliver (CEO and founder of MSA), this distribution range is when buyers and sellers have a bit of an arm wrestle. Then, the buyers gain the upper hand, and the price shoots out of the distribution range.
|
|
| Source: MSA |
And, just to prove that when it comes to human nature, everything old is new again, here’s the same pattern repeated prior to the 1929 and 1987 crashes…
|
|
| Source: MSA |
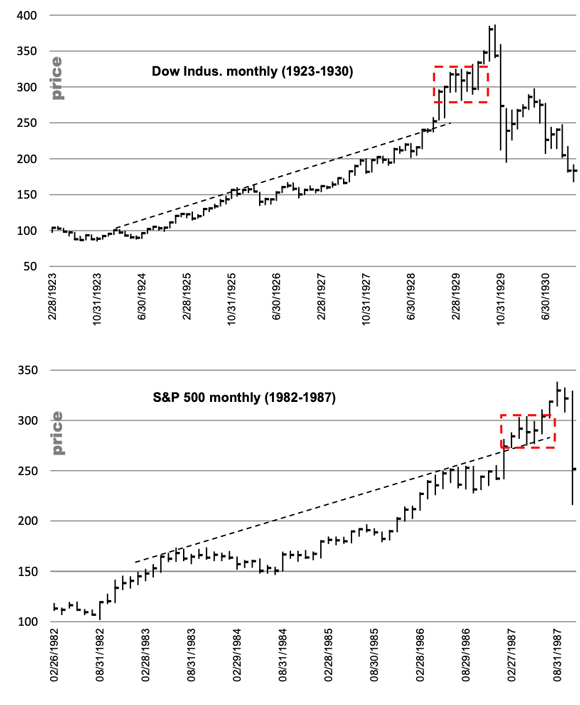
Last week I recorded a chat with Michael Oliver for members of The Gowdie Advisory and he said to me that if Nvidia falls back into the ‘distribution range’, then watch out.
Where’s the top of the ‘distribution range’?
Just over US$400.
What price did Nvidia close at last night?
US$406.
If history is any guide, it looks like things are going to get very interesting on Wall Street.
Regards,
 |
Vern Gowdie,
Editor, The Daily Reckoning Australia
