
For those baffled by Wall Street’s miraculous ‘recovery’ in 2023, today’s morning edition of Sky News solved the mystery…
|
|
| Source: Sky News |

Bad news for the Bulls…park rangers have now released the Bear.
Watch out. Grrrrr.
Two long term trends on a collision course
In last Tuesday’s Daily Reckoning Australia, we looked at the powerful drivers that propelled the S&P 500 to an extraordinary 48-fold gain over the past four decades.
The period of gain — which has been almost, but not quite, all my adult life — is why we expect the share market to be our retirement benefactor for the remainder of our adult lives.
It has gone on for so long that we simply expect it’ll continue in a ‘business as usual’ fashion. But that’s not how long-term cycles work.
There are prolonged periods of outperformance followed by underperformance.
Even the US Federal Reserve recognises the factors behind the last four decades of outperformance on Wall Street, are all but exhausted.
To quote from last week’s Daily Reckoning Australia…
‘In June 2023, the Fed published this discussion paper…
|
|
| Source: US Federal Reserve |
‘After studying 60-years (from 1962–2022) of earnings data and S&P 500 performance, the paper concluded (emphasis added):
“…the 30-year period prior to the pandemic was exceptional.
“During these years, both interest rates and corporate tax rates declined substantially. This had the mechanical effect of significantly boosting corporate profit growth.
“Specifically…the reduction in interest and corporate tax rates was responsible for over 40% of the growth in real corporate profits from 1989–2019.
“Moreover, the decline in risk-free rates over this period explains the entirety of the expansion in price-to-earnings (P/E) multiples.
“Together, these two factors therefore account for the majority of this period’s exceptional stock market performance.”
‘The three unrepeatable drivers of stock returns
‘Earnings were boosted by…
‘Falling interest rates.
‘Falling Corporate Tax Rates.
‘Share prices were increased by…
‘P/E multiple expansion.’
As discussed last week, each of these three factors has (just about) had its day and is unlikely to be repeated. The next decade or two for share investors is shaping up to be rather difficult.
The timing of this reversal in fortunes could not be worse.
Why?
Because it also coincides with a slow-moving change in another longer-term trend.
In a world of instant everything, waiting patiently for trends to play out is definitely not most people’s cup of tea.
And that’s completely understandable.
There is so much content vying for our attention these days.
Taking time out to ponder the shifting patterns of society is a luxury few can afford.
However, those trends are what influence the economy and financial markets…and they are on a collision course.
The 20th century was like no other century in history
From 1900–1999 so much changed…and most of it in the second half of the 20th century.
Population growth on an unprecedented scale (due to lower infant mortality rates, baby booms and longer life expectancies).
Industrial Revolution leading to the technology revolution.
Quantum leaps in medical science.
The sophistication of financial markets.
Fractional banking.
Women entering and remaining in the workforce.
Expansive welfare systems.
Pension funds.
What we take for granted as ‘normal’, is, in the context of history, far from normal.
The society we know today has largely been a construct of the past 70 years.
The problem is that the 21st century now must deal with the legacies from the 20th century.
An ageing population…the ratio of non-workers to workers is increasing.
Unfunded welfare and healthcare commitments.
Society’s increased expectations of a certain standard of living (irrespective of whether we can afford it or not).
Declining birth rates.
The immense financial cost of trying to reduce carbon emissions.
Financing national defence systems against renewed external threats.
An economy caught in a massive debt trap.
The demographic and debt trends responsible for creating these legacies are on the cusp of changing.
Are we turning Japanese?
We know from Japan’s experience that a society’s transformation process can be long and (financially) painful.
Japan’s demographic sweet spot (when the ratio of non-working age citizens was lower than the working age cohort of over 15s and under 65s) was the key driver behind Japan’s economic glory…especially in the 1980s.
|
|
| Source: knoema.com |
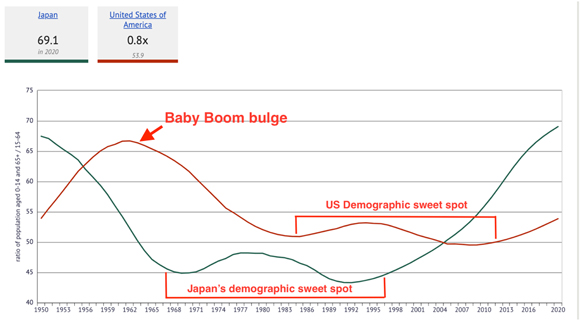
When Japan’s ratio of non-working age population to working age population began to increase, sustainable economic growth became a distant memory…a forlorn ideal from glory days past.
The US is now where Japan was 25–30 years ago.
Is this slowing economic growth trend going to impact the US and the rest of the West in the same way?
Highly likely.
The power of the demographic trend on asset prices is evident in these next two charts.
Follow the leader
In 1960, the Nikkei 225 and the Dow Jones were at similar starting levels.
The Nikkei 225 began the year at 1000 points and the Dow Jones Index was around 700 points.
But after that, it was a tale of two indices.
While the US future labour force was making its way out of the labour ward, Japan’s share market was making its way to much higher levels…steadily at first, then exponentially.
|
|
| Source: Macro Trends |
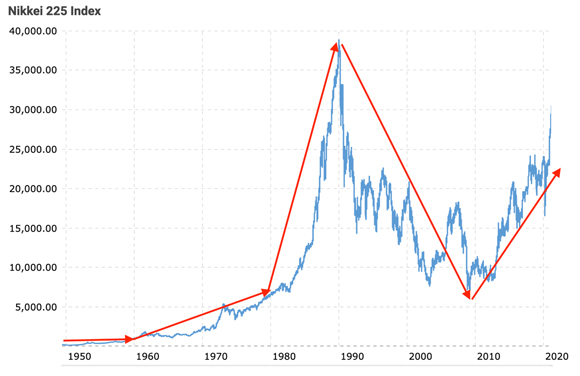
Whereas the Dow, well, was stuck in that sub-1000-point range for over two decades.
And, when the Nikkei surged to almost 39,000 points in late 1989, the Dow was nudging a mere 2500 points.
|
|
| Source: Macro Trends |
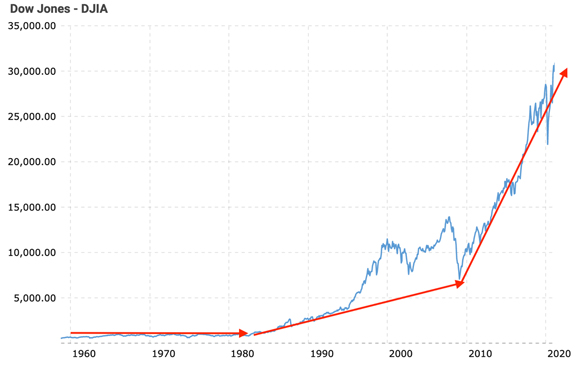
Then the Dow played follow the leader.
Repeating an all too familiar pattern…steadily at first, followed by the exponential.
Trends take time (years, decades and even centuries) to evolve…but what usually happens at the end of a very long trend is a hastening of action borne from conviction.
Society becomes so convinced that what they’re experiencing is a permanent state of affairs. What has been will continue to be so.
Time marches on and so do the dynamics that were instrumental in creating those (as we know it, temporary) state of affairs.
It’s taken decades for the debt and demographic trend in the US to reach a turning point.
Japan’s post-1990 experience provides an insight into the fate that possibly awaits over-valued asset markets.
As Ray Dalio identified in his extensive research on empires…
‘… going from one extreme to another in a long cycle has been the norm, [is] not the exception—that it is a very rare country in a very rare century that doesn’t have at least one boom/harmonious/prosperous period and one depression/civil war/revolution, so we should expect both.
‘Yet, I saw how most people thought, and still think, that it is implausible that they will experience a period that is more opposite than similar to that which they have experienced.’
Human nature is why the patterns, down through the ages, are so repeatable.
While the US and Japan are not a perfect overlay, the similarities in debt-funded economic ‘success’; transitioning out of the demographic sweet spot and the exponential asset pricing phase that comes with trend extrapolation, are too great to ignore.
In my opinion, the US is going to continue to play follow the Japanese leader.
This is why a 60% or even, 70% collapse on Wall Street will come as no surprise.
The only unknowns are…when it starts and how long it takes.
That baby boom bulge is now moving its way into retirement…at precisely the time when the primary wealth creator of Boomer retirement capital (shares) is poised to spring a very nasty and unexpected surprise.
The choices we make today are likely to have a profound impact on the trend each of our lives takes in the coming years and decades.
Regards,
 |
Vern Gowdie,
Editor, The Daily Reckoning Australia
