
We’re turning over a new leaf here at Fat Tail Daily. I’m going to be your daily editor from here on in.
Don’t stress if you’re a fan of Ryan Dinse or Brian Chu. They’ll still be contributing.
This is going to be an exciting few weeks in Fat Tail Daily.
I can’t give you full details at this stage.
But I can tell you we’ve partnered up with a pretty famous investor.
In order to bring you a fascinating…and potentially very profitable…story.
All I’ll tell you now is it centres around Elon Musk…a backroom meeting that took place a mile from the White House (that wasn’t reported on by the press)…
…and something big that’s going to send shockwaves throughout the world, potentially in the last week of May.
Apologies for the smoke and mirrors. But that’s all I’ll say today.
Except for if you think Musk and Trump’s shenanigans plan to radically reshape the US government is the big story of 2025…
…just wait till you hear what we have to show you soon!
Stay tuned…
Right now, I’m now tasked with bringing you the three top things you need to know each morning.
With that mind…
1) All last week Fat Tail Daily explored the twists and turns going on in the gold market around the world.
I’ve got more to add today too.
We got a big, juicy clue last week that this precious metal bull market could have a long way to run yet.
Let me tell you about mining service company Imdex [ASX:IMD] to see why.
This is a recommendation of mine from February last year, actually. It’s currently up 92% for readers of my newsletter Australian Small-Cap Investigator.
That’s not why we’re talking about it now, though.
Imdex put out their results last week. They provide drilling services and data analysis for mining companies.
You’d expect things to be humming for them with the gold price roaring like it is now.
Not so. Why’s that?
Mining exploration has gone down for four quarters in a row.
That puts Imdex in a tough industry dynamic.
Their group revenue was, in fact, down 10% on the previous half.
You’d usually expect the market to sell off the shares with falling revenue like that.
But Imdex’s shares went up!
What’s going on?
Here’s the big point…
The market is looking at the barnstorming gold price and projecting big exploration dollars to come out in 2026 and 2027…and beyond.
Imdex is now trading on 20x earnings even if the exploration spending hasn’t picked up yet.
This is why my colleague Brian Chu is saying to anyone that will listen that NOW is the time to consider the gold juniors.
Brian tells us that the huge cash flows running through the gold industry should flow to the smaller end of the market.
The big gold companies are going to use their massive cash flows to buy up projects, finance exploration and consolidate different gold regions.
Clearly, the market thinks the same thing.
That’s why it’s prepared to bid up Imdex even though exploration spending is still subdued and preventing the company from producing its best results yet.
Here’s the chart of IMD over the last year…
| |
| Source: Imdex |
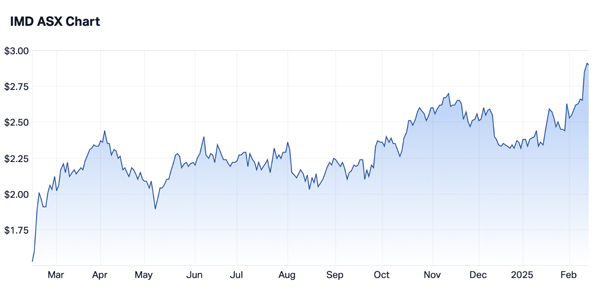
This is the power of the gold bull market at work. The outlook gets better for Imdex every time the gold price goes up.
The same is true for gold juniors that rely on investor support to finance their capital development or exploration campaigns.
Now, not all gold stocks will perform like this, they carry high risks after all, but as you can see, the setup is there…
Brian calls it the coming ‘Gold Fever’, and quite rightly so. Make sure you check out his latest analysis here.
We’re nothing close to the peak of this gold bull market, in my view. See my colleague, Murray Dawes’ Chart of the Day for more on that below.
(By the way, Murray will have a chart of the day every day in Fat Tail Daily from now on. Make sure you check it out following my essay.)
2) The result wasn’t all bad for Imdex. They paid down debt in the half and did what they could with what they had to work with.
They held their margins and market share steady. They should be in a net cash position by next year. They’ve also heavily invested in R&D, including AI, of course, that could bear fruit in future years.
Imdex says the record for exploration spending was US$21 billion in 2012. It’s about half that today.
In other words, the world has a long way to go to get back to the former boom time highs at the peak of the last commodity boom.
Here’s the other thing we get from Imdex: 75% of exploration money goes into copper and gold.
Both gold and copper are up at least 10% so far in just the first six weeks of the year. This validates the market’s view that Imdex could likely go into a strong period ahead.
I’m not recommending my subscribers sell now, that’s for sure. But it may hold around this price until we get a clear recovery in exploration spending.
3) As I mentioned, make sure you keep reading below. My colleague and technical guru Murray Dawes will now be posting a Chart of the Day in every issue of Fat Tail Daily.
Murray is a superb technical analyst. He also initiated some cracking gold positions just as they broke out late last year for his subscribers.
Murray shows us below why US$8,000 is not as crazy as it sounds when you look at history…
Best wishes,
 |
Callum Newman,
Editor, Small-Cap Systems and Australian Small-Cap Investigator
Murray’s Chart of the Day
| |
| Source: Tradingview.com |
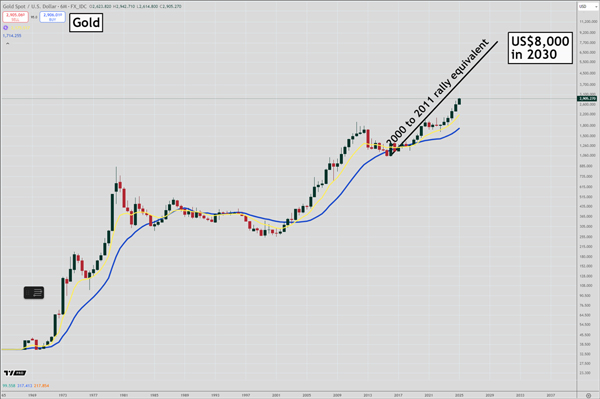
This is a chart of gold going all the way back to 1971 when the US dollar was taken off the gold standard.
The scale on the chart is what is known as a logarithmic or log scale.
That just means that percentage moves look the same anywhere on the chart. That isn’t the case on a normal scale.
It helps to use a log scale when you are looking at data over very long periods of time.
The first obvious observation is that trends in the gold price can last for a very long time.
Most people anchor their expectations about what they think the price of a stock or commodity will do to the current price.
That is often a mistake and means you underestimate how far prices can go.
To show you what I mean I have drawn a line that is the exact replica of the rally that we saw in gold from 2001 to 2011, when the price of gold jumped from US$255 to US$1,900.
I have placed that line at the lowest point of the correction in gold in 2015.
Based on that actual rally that occurred, it means the price of gold would have to rally to US$8,000 by 2030 to replicate it.
Most people would laugh in your face if you said gold could hit US$8,000 by 2030. But based on history it is not as far-fetched as it sounds.
Regards,
 |
Murray Dawes,
Editor, Retirement Trader, Fat Tail Microcaps, and Fat Tail Alliance

Comments