• Skip to primary navigation
  • Skip to main content
  • Skip to primary sidebar
  • Skip to footer

Fat Tail Daily

Investment Ideas From the Edge of the Bell Curve

  • Menu
    • Commodities
      • Resources and Mining
      • Copper
      • Gold
      • Iron Ore
      • Lithium
      • Silver
      • Graphite
      • Rare Earths
    • Technology
      • AI
      • Bitcoin
      • Cryptocurrency
      • Energy
      • Financial Technology
      • Bio Technology
    • Market Analysis
      • Latest ASX News
      • Dividend Shares
      • ETFs
      • Stocks and Bonds
    • Macro
      • Australian Economy
      • Central Banks
      • World Markets
    • Small Caps
    • More
      • Investment Guides
      • Premium Research
      • Editors
      • About
      • Contact Us
  • Latest
  • Fat Tail Series
  • About Us
Market Analysis Latest ASX News

The Reject Shop Share Price Hits a Ceiling (ASX:TRS)

Like 0

By Lachlann Tierney, Monday, 21 September 2020

Throughout the pandemic months of 2020, the Reject Shop Ltd [ASX:TRS] proved itself to be the quite achiever.

Gaining over 250% in its share price since the low in March, the company made hay while the sun shone throughout the COVID-19 crisis — but it now looks like it may be tapped out at $7.58, at time of writing.
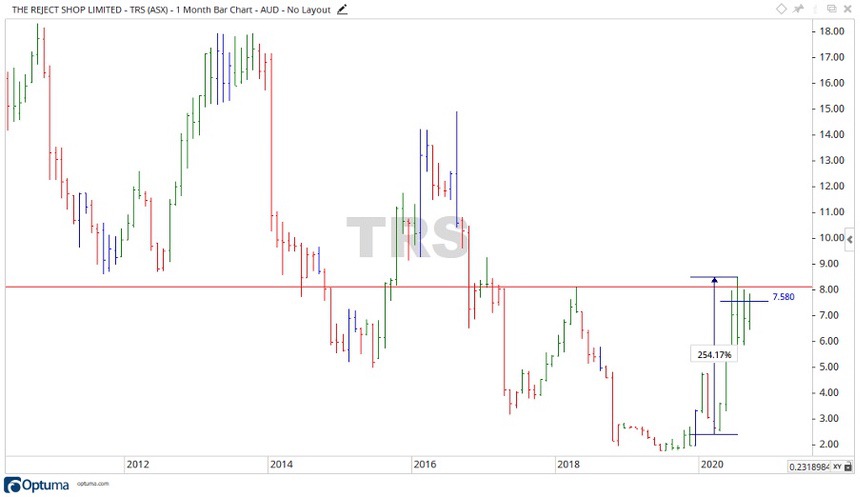
ASX TRS share price chart 1

Source: Optuma

What’s happening over at The Reject Shop?

With 365 locations around the nation, the company is definitely well known.

Sure, it may not have the sparkle of other retailers like Myer Holdings Ltd [ASX:MYR] or JB Hi-Fi Ltd [ASX:JBH].

Yet throughout the course of the pandemic The Reject Shop outgrew them both!
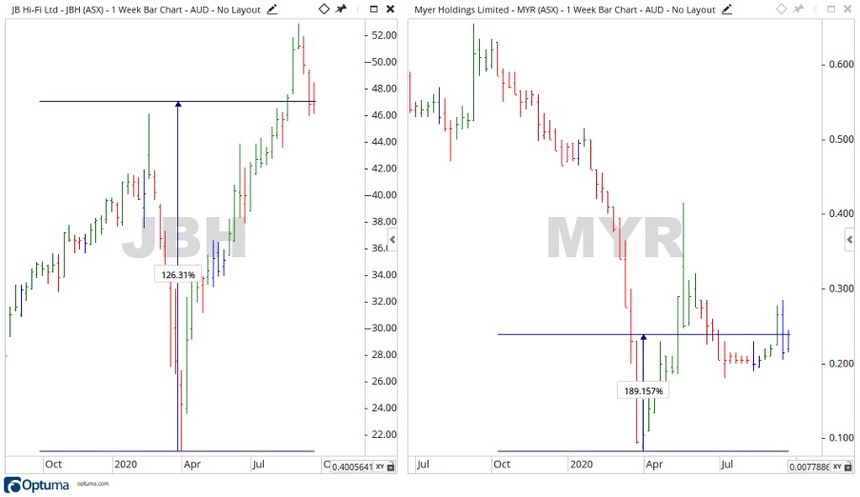
ASX JBH and ASX MYR shares

Source: Optuma

  • JB Hi-Fi Ltd [ASX:JBH] = 126.31%
  • Myer Holdings Ltd [ASX:MYR] = 189.15%
  • Reject Shop Ltd [ASX:TRS] = 254.17%

Couple this with FY20 sales of $820.6 million, a strong balance sheet with $92.5 million cash and no drawn debt, it’s easy to say the company has banked a pretty decent year so far.

They did this by pivoting towards the more consumable products people would need in a pandemic and even having a line of goods from Tesco in the UK. I imagine this would be a welcome taste of home for those from the UK stuck in lockdown.

Where to from here for The Reject Shop?

After the solid rise in the share price hit a peak of $8.50 in mid-July, it has really just moved sideways and into the formation of a flag pennant pattern, as you can see in the chart below.
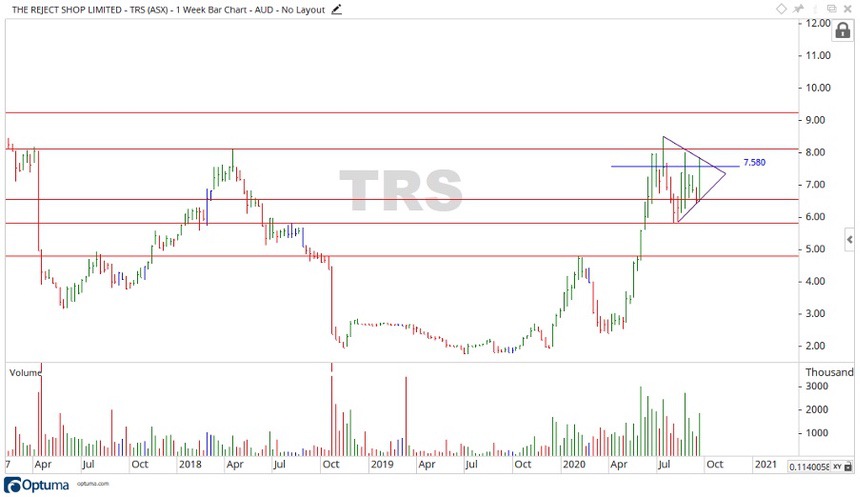
ASX The Reject Shop Share Price Chart 2

Source: Optuma

What tends to happen with flag pennants is that a bit of a vacuum can form at the end of the flag.

As the bars get shorter and the volume declines into the pattern, it gets closer to either the buyers or sellers taking control of the next move.

Once the share price pops out of the pattern it can move quickly at times.

In the case of The Reject Shop, the share price moved up to the level of $8.15, which was strong enough to turn the move back. For the share price to be considered bullish once more, it would have to move up beyond this level.

The downside being that spending in retail looks to be slowing down, illustrated by the growth in household savings this year.

The Reject Shop might be a little immune to this due to the nature of goods they sell, but you never know. It can pay to be cautious.

If the share price were to fall back the then levels of $6.60, $5.80, and $4.80 may be enough to halt a fall.

As you can see from the chart above, when the share price does fall in this stock, it tends to fall away very quickly.

Regards,

Carl Wittkopp

For The Daily Reckoning Australia

All advice is general advice and has not taken into account your personal circumstances.

Please seek independent financial advice regarding your own situation, or if in doubt about the suitability of an investment.

Comments

Subscribe
Notify of
guest
guest
0 Comments
Inline Feedbacks
View all comments
Lachlann Tierney

Lachlann’s Premium Subscriptions

Publication logo
Fat Tail Investment Research

Latest Articles

  • Gold bugs and Bitcoin maxis: THIS is your common enemy
    By Brian Chu

    The longstanding rivalry between the gold and Bitcoin camps miss the point that they share a common enemy and benefactor, fiat currencies. Ignore the rivalry and use both to build your wealth now.

  • End of the (Production) Line: Rare Earths
    By James Cooper

    According to geologist James Cooper, safeguarding supply chains is no longer a matter of maintaining profits or avoiding production delays; this is a race for survival for household names like Toyota or Mitsubishi.

  • Virgin IPO: Another Sign for the Bulls
    By Callum Newman

    One of the points I made in 2024 was that the IPO market had dropped like a stone – a sign of a bottom forming at the time. That’s why the news today stick out like the proverbial. The Virgin Australia IPO is now on. It’s been brewing for 2.5 years!

Primary Sidebar

Latest Articles

  • Gold bugs and Bitcoin maxis: THIS is your common enemy
  • End of the (Production) Line: Rare Earths
  • Virgin IPO: Another Sign for the Bulls
  • I’m Reading the Market Pulse This Way
  • What’ll happen to Australia in the next sovereign debt crisis?

Footer

Fat Tail Daily Logo
YouTube
Facebook
x (formally twitter)
LinkedIn

About

Investment ideas from the edge of the bell curve.

Go beyond conventional investing strategies with unique ideas and actionable opportunities. Our expert editors deliver conviction-led insights to guide your financial journey.

Quick Links

Subscribe

About

FAQ

Terms and Conditions

Financial Services Guide

Privacy Policy

Get in Touch

Contact Us

Email: support@fattail.com.au

Phone: 1300 667 481

All advice is general in nature and has not taken into account your personal circumstances. Please seek independent financial advice regarding your own situation, or if in doubt about the suitability of an investment.

The value of any investment and the income derived from it can go down as well as up. Never invest more than you can afford to lose and keep in mind the ultimate risk is that you can lose whatever you’ve invested. While useful for detecting patterns, the past is not a guide to future performance. Some figures contained in our reports are forecasts and may not be a reliable indicator of future results. Any actual or potential gains in these reports may not include taxes, brokerage commissions, or associated fees.

Fat Tail Logo

Fat Tail Daily is brought to you by the team at Fat Tail Investment Research

Copyright © 2025 Fat Tail Daily | ACN: 117 765 009 / ABN: 33 117 765 009 / ASFL: 323 988