
Last week I wrote about the ‘cheapest’ stocks on the ASX.
So today, I thought I’d cover the most expensive ASX stocks.
Given that the ASX 200’s historical P/E ratio is about 15, a stock with a P/E multiple north of 20 is considered pricey.
Filtering for mid- to large-cap stocks, here are the stocks with the highest P/E on the ASX:
|
|
| Source: CommSec |

The methodology of deriving the P/E is important here.
I’ve used the CommSec screener. CommSec takes the current price divided by the average of the last actual earnings per share figure and the projected EPS figure for next year.
So these P/E ratios are more balanced — a composite of the recent earnings past and the near earnings future.
But it does mean it throws up some anomalies like Xero, which saw FY21’s net profit of $19.8 million fall to a net loss of $9.1 million in FY22.
If we take the trailing 12-month P/E figure alone, we get some astronomical readings.
|
|
| Source: Trading View |

In either case, we see that toll operator Transurban comes first by a fair margin. That’s interesting.
How can a stolid ASX heavy hitter like Transurban, with a market cap of more than $40 billion, trade at a dotcom bubble P/E multiple?
One thing to note is that high P/E multiples can result from high returns on capital rather than high revenue growth.
As a McKinsey research paper explained:
‘High multiples can result from high returns on capital in average or low-growth businesses just as easily as they can result from high growth. But beware: any amount of growth at low returns on capital will not lead to a high P/E, because such growth does not create shareholder value.’
But Transurban’s return on capital isn’t exactly stellar.
TCL reported a return on equity of 2% in FY22, albeit consensus estimates have the toll operator raising its ROE to a more respectable 7.7% in FY25.
TCL shares are possibly being propped up by the company’s dividend distribution, which is set to increase in the years ahead.
Transurban’s expected distribution in FY23 is expected to rise 30%.
Nonetheless, it will be interesting to see how Transurban shares fare over the next 12 months.
It’s also interesting to see uranium miner Boss Energy make the list.
One way to interpret it is to argue the uranium stock is being bid up too much on hype, and another is to argue that commodity stocks are most attractive when they seem expensive.
Peter Lynch made this point in one of his books, where he said:
‘Buying a cyclical (e.g. commodities) after several years of record earnings & when the P/E ratio has hit a low point is a proven method for losing half of your money in a short period of time.’
Commodity stocks’ earnings usually peak at the top of the cycle. As the market begins to price in the winding down of the cycle — and a normalised earnings outlook — the recent record earnings make the P/E ratios appear very low.
On the other hand, an ‘expensive’ commodity may indicate the start of a cycle, with the market yet to price in the stronger earnings outlook.
From P/E to PEG
We can refine the P/E filter by adding a new metric — Price-Earnings Growth (PEG).
The PEG ratio divides a stock’s P/E by its earnings growth rate over a defined period. Using the PEG gives a fuller picture than the P/E alone.
Specifically, it can help with judging whether a stock’s P/E is warranted.
Say a firm has a P/E of 50 but EPS growth year-over-year of 100%. Its PEG will be 0.5.
A PEG lower than one is usually considered best, suggesting a stock is potentially undervalued…even if the P/E looks high.
The PEG ratio was popularised by Peter Lynch, who wrote in his book One Up on Wall Street:
‘The P/E ratio of any company that’s fairly priced will equal its growth rate.’
Only four mid- to large-cap stocks with a P/E of more than 50 had a PEG ratio of less than one, according to CommSec.
Here is the list:
|
|
| Source: CommSec |

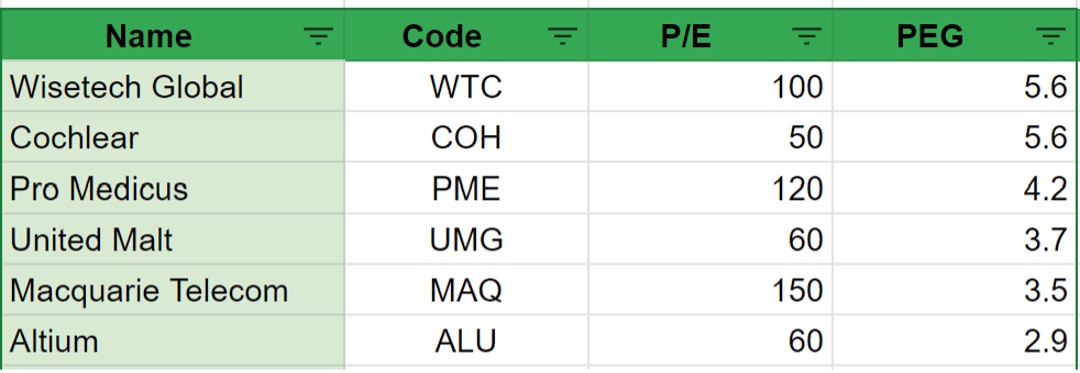
What about stocks with high multiples and a high PEG ratio?
WiseTech Global [ASX:WTC], Pro Medicus [ASX:PME], and Cochlear [ASX:COH] top the list:
|
|
| Source: CommSec |
Are these stocks overpriced? Are they set for a correction?
Potentially.
Professor of financial accounting Stephen Penman cited evidence showing that the market often pays too much for expected growth. High P/E stocks often underwhelm:
‘There is considerable evidence that the market overprices growth, at least some of the time. High P/E stocks—growth stocks—often disappoint, delivering lower returns than low P/E stocks. The high-price multiples of the late 1990s priced growth that was not realized. Indeed, research indicates that over the last fifty years, firms on average did not deliver the long-term cash flows forecast in stock prices.’
The high PEG ratios of WiseTech, Cochlear, and Pro Medicus suggest these stocks are currently being priced for growth they’re not delivering.
We can quickly test Penman’s thesis by checking the recent performance of high P/E stocks.
In November last year, Stockhead ran an article listing some of the ASX stocks with the highest P/E ratios at that time.
Here are the top five with the share price performance since November 2021:
|
|
| Source: Stockhead; CommSec |

So, beware of the high P/E stock and check whether its earnings growth justifies the multiple.
And remember never to overpay for growth.
Until next week,
 |
Kiryll Prakapenka,
For Money Morning
PS: Before I go, I wanted to quickly remind you of an upcoming presentation by veteran investment strategist Jim Rickards and his team on the dangers of Central Bank Digital Currencies (CBDCs). CBDCs aren’t a gizmo anymore. Thanks to a trial happening in Australia right now, we could soon wake up to the news that cash is to be replaced with ‘e-dollars’. E-dollars the government can possibly track, and central banks can potentially manipulate. Who knows what can happen? Whatever the case, CBDCs are definitely a development you should learn more about. You’ll have the opportunity to do so tomorrow…
