ASX News LIVE | XJO Down as Breville, Adairs, Chorus, NIB, A2 Milk, Ampol Report
Aussie 10-year yield higher than ASX 200 forward dividend yield
Australia 10-year bond trading with a higher yield than ASX 200 forward earnings. Hasn't been seen since before the GFC. Important development for asset allocation #ausbiz
Morgan Stanley chart. pic.twitter.com/vJPiI8vJh0
— David Scutt (@Scutty) August 21, 2023
Monday markets: why gold and iron ore are under pressure
Here is an excerpt from Greg Canavan’s latest market commentary in The Insider.
***
For the past month or so, I’ve been writing about how the Aussie market looks expensive and is more risk than reward right now.
The market decided to run with this interpretation last week, with the ASX 200 declining a hefty 2.6%. The biggest falls came in the gold sector (down 4.7%) and resources (down 3.7%). The financials also chipped in with a 3.6% decline.
What was behind the falls?
There were two main reasons, contradictory ones at that.
On the one hand, China’s weak economic performance and highly indebted property sector are causing problems again. There are real concerns that the latest property market woes could lead to severe financial consequences unless addressed by the authorities.
But authorities are reluctant to do too much as they don’t want to pump the system back up.
To make matters worse, China’s population has stopped growing. 2022 was the inflection point. According to a recent article in The Guardian:
‘Last year, China’s population shrank for the first time in six decades, falling by 850,000 to 1.41 billion. It is predicted to fall below 1 billion before the end of the century. In April this year, India’s population hit an estimated 1.43 billion, overtaking China as the world’s most populous country.’
That’s a difficult equation when you have an oversupply of property. The government really won’t want to reignite speculation in this sector. They simply can’t afford to, from both a short- and long-term perspective.
This is why the resources sector came under pressure last week, specifically the iron ore miners. But as I explained in our latest What’s Not Priced In podcast episode, there is reason to believe that the longer-term outlook is grim for the iron ore majors.
You just need to look at Rio Tinto [ASX:RIO]. In the first half (six months to 30 June), the iron ore division accounted for 83% of underlying earnings. It generated a 63% return on capital employed, compared to just 4% in the aluminium and copper divisions.
Rio is an iron ore company, not a diversified miner. Despite the headwinds for the iron ore price, consensus earnings estimates have Rio generating a US$10.4 billion profit in CY23, US$10.7 billion in CY24 and US$10.3 billion in CY25.
That is, stable profits.
Now, compare that to Fortescue Metals Group [ASX:FMG], which generates all its profits from iron ore.
Consensus earnings forecasts predict net profit of US$5.6 billion in FY23, US$4.2 billion in FY24, and US$3.4 billion in FY25. So a 40% profit decline forecast for the next two years…
…versus a stable outlook for Rio.
Admittedly, Fortescue has a lower-quality product than Rio and has greater sensitivity to iron ore prices. But this difference in consensus forecasts looks extreme. Expect lower earnings revisions for Rio to come.
The iron ore majors have done very well from an elevated iron ore price over the past few years. But my guess is that iron ore is headed towards US$80 per tonne or lower in the years to come.
As you can see in the chart below, the iron ore price generally tracks the Chinese yuan/US dollar exchange rate. But since May, this relationship has diverged.
The yuan recently fell to its lowest level since October last year. Back then, the iron ore price was US$80 per tonne. Now, it’s around US$105 per tonne.
Having said all that, these stocks are oversold in the short term. A short-term bounce shouldn’t be surprising. But from a longer-term perspective, they look challenged. Don’t be fooled by their single-digit P/E multiples.
That’s on the proviso that China doesn’t throw in the towel, bail out the property sector and reignite speculation with an injection of cheap credit!
Adairs: ‘near-term outlook likely to remain challenging’
Adairs is not upbeat about the near-term outlook, arguing it will ‘remain challenging given prevailing macro-economic headwinds’.
This challenging environment is leading Adairs to implement ‘material cost reduction initiatives that seek to manage the business appropriately’.
It’s also leading management not to provide FY24 guidance at this time.
However, Adairs did provide a sales update for the first seven weeks of FY24.
Group sales are down 8.9% on the comparable FY23 period, with ADH’s Focus the worst hit (sales down 11%).
One positive from the trading update was group margins tracking ahead of last year. But Adairs didn’t specify by how much.
Adairs falls 15% as FY23 net profit tumbles
Home furniture retailer Adairs [ASX:ADH] is down 15% today after continued sales growth was not enough to prevent a fall in profit.
Adairs prefaced its results announcement with the fact it has reported over ten consecutive years of sales growth since listing.
However, lower margins and higher costs pressured profitability.
While group sales rose 10.1% to $621.3 million, underlying NPAT fell 22.2% to $40.2 million. That marks a net profit margin of just 6.5%, down from 9.1% in FY22.
The fall in profit meant Adairs decided not to pay a final dividend in FY23, meaning total dividends per share fell 56% YoY to 8 cents.
ADH’s core brand saw total sales rise only 2.9% YoY, while EBIT fell 37% to $35 million, an EBIT margin of 8.1%.
The EBIT margin is well down on its most recent pre-pandemic year, when the margin was 12.6% in FY19.

Source: Adairs
Adairs falls 15% as FY23 net profit tumbles
Home furniture retailer Adairs [ASX:ADH] is down 15% today after continued sales growth was not enough to prevent a fall in profit.
Adairs prefaced its results announcement with the fact it has reported over ten consecutive years of sales growth since listing.
However, lower margins and higher costs pressured profitability.
While group sales rose 10.1% to $621.3 million, underlying NPAT fell 22.2% to $40.2 million. That marks a net profit margin of just 6.5%, down from 9.1% in FY22.
The fall in profit meant Adairs decided not to pay a final dividend in FY23, meaning total dividends per share fell 56% YoY to 8 cents.
ADH’s core brand saw total sales rise only 2.9% YoY, while EBIT fell 37% to $35 million, an EBIT margin of 8.1%.
The EBIT margin is well down on its most recent pre-pandemic year, when the margin was 12.6% in FY19.
Source: Adairs
Iress down 30% on half-year results, suspends dividend
Financial services software company Iress [ASX:IRE] is down 30% after releasing its half-year results and suspending its interim dividend.
Iress said the dividend suspension was a ‘prudent decision’ to reduce debt ‘at a time when it is incurring high one-off costs from the company’s transformation plan’.
Looking ahead, Iress said the second half of 2023 will see softening revenue growth, mitigated somewhat by ‘cost measures and transformation initiatives’.
However, Iress did lower its underlying EBITDA expectations, now guiding for flat half-on-half growth.
Over the longer term, IRE forecasted FY24 underlying EBITDA growth of 5-10%.
Citi Economic Surprise Index near highs
Economic surprises just keep on coming.
Economists and traders keep getting bamboozled.
With the exception of the second half of 2020 — when the economy started rebounding far faster than economists had anticipated — the Citi Economic Surprise Index has basically never been higher. The pace and sustainability of growth catching almost everyone offsides. pic.twitter.com/YhrJmXsM9v
— Joe Weisenthal (@TheStalwart) August 21, 2023
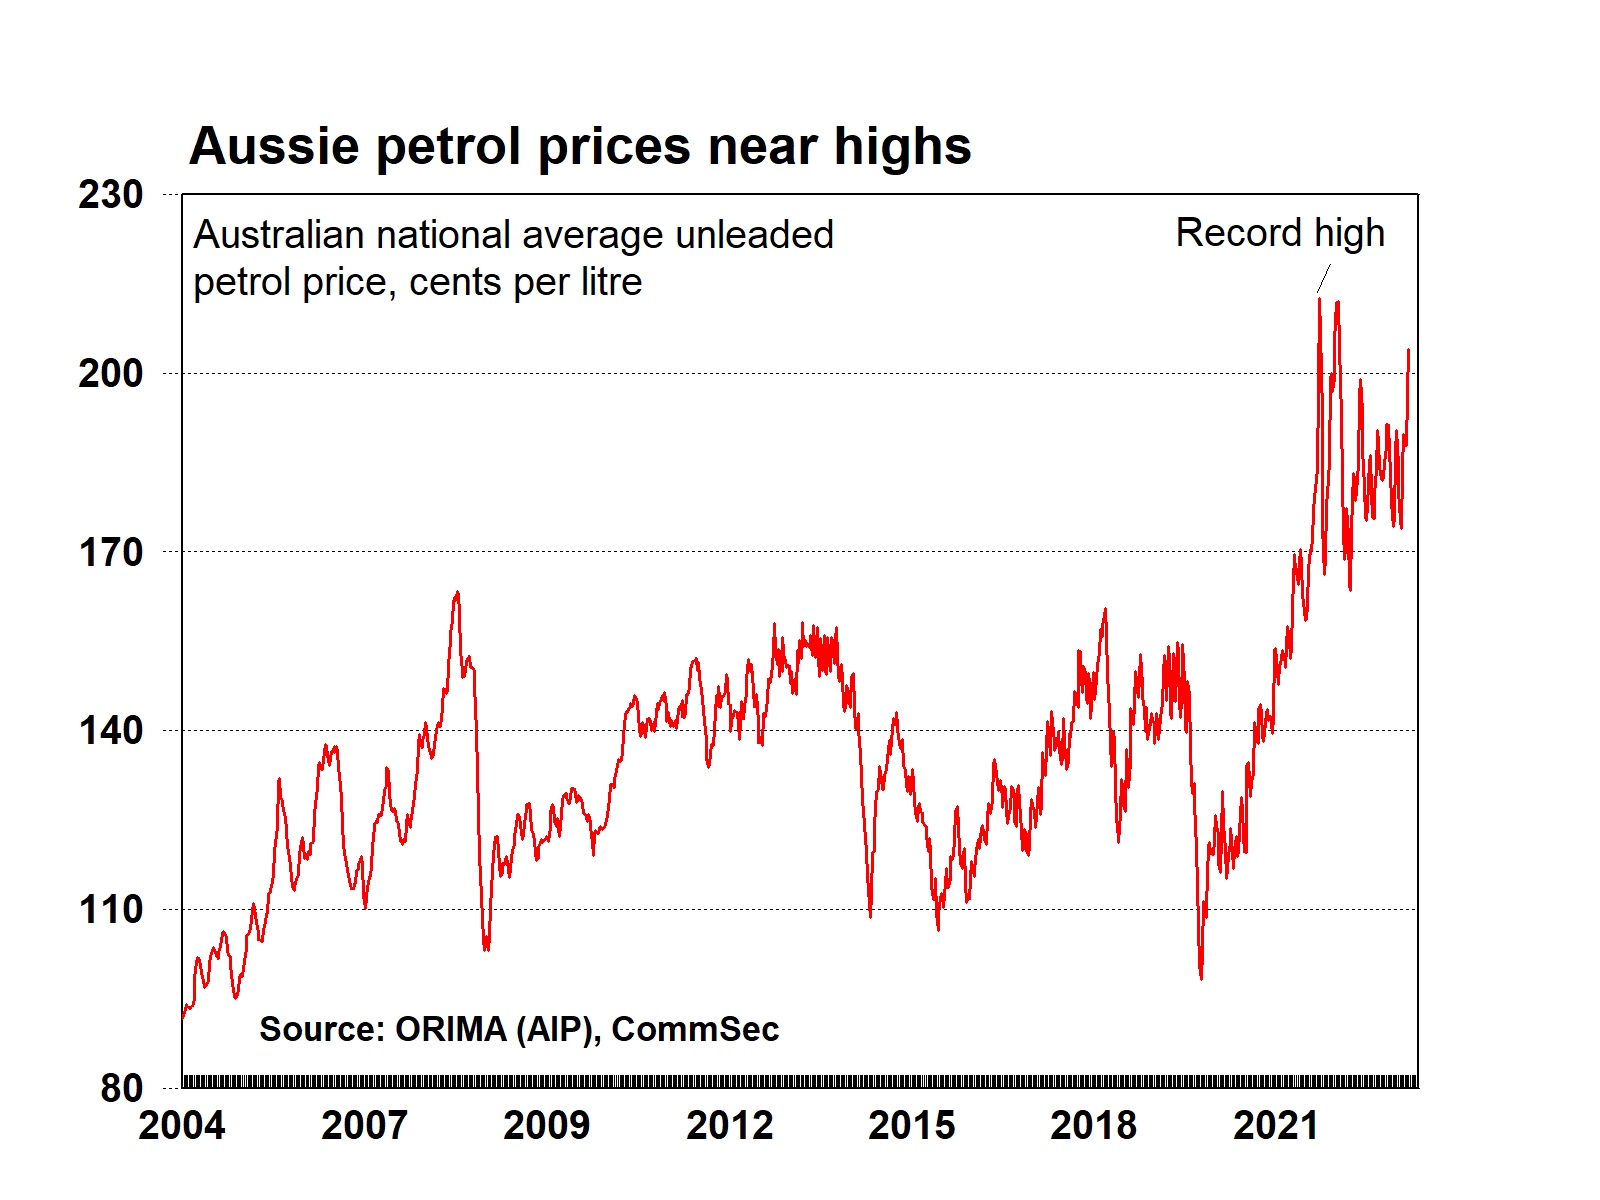
Australian petrol prices near record highs
We are paying big for petrol again.
Petrol prices across the country are nearing record highs.
Australian petrol prices near record highs
We are paying big for petrol again.
Petrol prices across the country are nearing record highs.
China’s central bank cuts 1-year loan prime rate by less than expected to 3.45%
The People's Bank of China cut the 1-year loan prime rate by 10 basis points from 3.55% to 3.45% (forecast: 3.40%). The 5-year rate was left unchanged at 4.20% (forecast: 4.05%). The 1-year rate affects corporate & household loans #ausecon #auspol #commsec @CommSec #China
— CommSec (@CommSec) August 21, 2023
Lithium sinks … is it time to bail out?
Over the last month, the lithium sector has been thumped.
Last year’s ASX darlings, Mineral Resources [ASX:MIN] and IGO [ASX:IGO], have been hammered with solid 30% declines this year…for the explorers and developers, losses have been worse still.
So, why are investors rushing for the exits on last year’s hottest stocks?
Well, there’s a little more to this story than just a falling commodity price…that’s what I’m attempting to unpackage today.
I believe the root cause of the negativity stems from wholesale buyers in China…the world’s most important market for lithium.
Physical traders act as intermediaries between the miners that supply the market and Li-ion battery makers who consume inventories.
Wholesalers want lower prices.
If they expect the commodity to fall, they’ll destock and clear out warehouses.
That creates a short-term glut in the market and the appearance of oversupply.
Volatility here has a direct impact on the miners…it’s a key reason why lithium stocks have sold off.
As you can see below, the Sprott Lithium Miners ETF [NASDAQ:LITP], made up of the world’s largest miners including Pilbara Minerals [ASX:PLS], Albemarle Corporation [NYSE:ALB], IGO, and Livent Corporation [NYSE:LTHM] has fallen more than 20% since mid-July.
The ETF is now approaching the major low made back in March 2023.

Source: Google Finance
But turning our attention to the fundamental side offers solid evidence that the fortunes of lithium miners could be about to turn.
Nearly 300,000 new electric vehicles (EVs) were sold across the US in Q2 2023, a record for any quarter.
It represents a staggering 48% increase from Q2 2022.
But perhaps more importantly, sales are booming in China according to the latest analysis from Deutsche Bank.
See for yourself below.
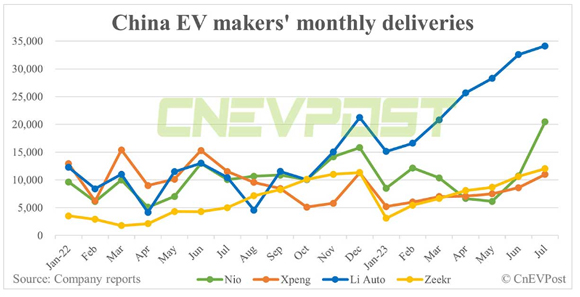
Source: CnEVPost
According to one of China’s largest EV firms, Li Auto, 2023 is defying expectations.
In its latest sales update, the company announced (emphasis added):
‘Delivery of 32,575 vehicles in June 2023, surpassing the 30,000 monthly delivery mark for the first time and representing an increase of 150.1% year over year.
‘This brought the company’s second-quarter deliveries to 86,533, up 201.6% year over year.
‘The company has already surpassed its total vehicle deliveries for the entire year of 2022 with its deliveries in the first half of 2023.’
There’s nothing here to suggest demand will drop for lithium…Li Auto’s sales growth (blue line above) is rocketing this year.
https://commodities.fattail.com.au/lithium-takes-a-diveis-it-time-to-bail-out/2023/08/18/
What a falling Australian dollar means: a thread
Why is the currency of an isolated, island country with only 25 million inhabitants so popular?
And more importantly, why’s it falling so fast right now?
Let’s dig in…https://t.co/rbEnNRVOD5
— Fat Tail Daily (@FatTailDaily) August 21, 2023
Aussie dollar flashes WARNING signal: Ryan Dinse
Did you know that our Australian dollar is the fourth most traded currency in the world?
More specifically, the AUD-USD pair is the fourth most traded currency pair.
It makes up 6.37% of total global forex volume.
The ‘Aussie’ itself is technically the fifth most traded currency when you consider all trading pairs.
In top place is the US dollar, followed by the euro, Japanese yen, and the British pound.
Then in comes little old us.
It begs the question: Why is the currency of an isolated, island country with only 25 million inhabitants so popular?
And more importantly, why’s it falling so fast right now?
Let’s dig in…
The reason the Aussie is traded so much is simple enough.
You see, our dollar is often used by investors as a proxy for global growth.
When the global economy is flying, our commodities are in high demand, so the value of the Aussie dollar generally rises too.
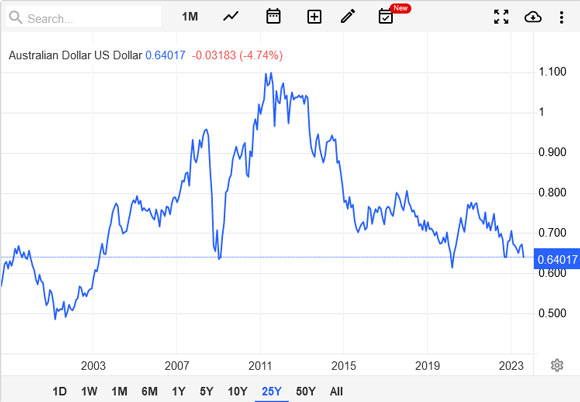
Source: Trading Economics
During the original mining boom years of 2003–07, we saw the value of the Australian dollar rise from 50 cents to almost US$1.
You can also see how fast the Aussie fell when the GFC hit in 2007.
That fall — near to the level we’re at today — was short-lived as central banks pumped money into the system.
2009 was the birth of large-scale quantitative easing (more colloquially known as money printing) and not uncoincidentally, the birth of Bitcoin too.
You can see the ‘printing’ of more US dollars had a big effect on the relative value of our currency.
And for a brief moment, the value of the Aussie was worth more than the mighty US dollar!
But since that peak in 2011, the Aussie has tumbled lower.
Last week, it started testing lows only seen in recent years at the crisis points of 2007 (GFC) and 2020 (the start of COVID).
It’s unlikely it’ll stay at this level for long.
The Aussie dollar has only spent 6.4% of its days in the 60–65 range since 1983, when the currency was first allowed to trade freely:
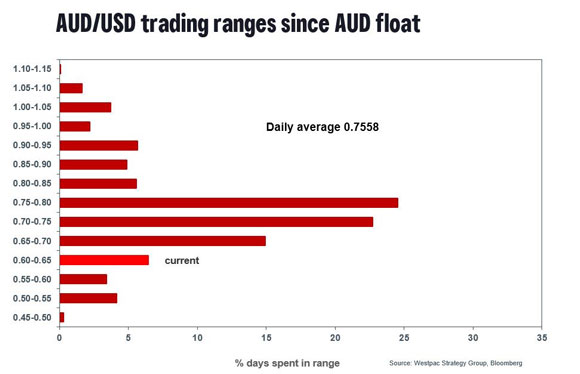
Source: Westpac Strategy Group
More importantly, if this current downtrend stays in place, it’s a sign that all is not well in the underlying economy.
And it’s clear this weakness in the AUD has caught many off guard.
https://www.moneymorning.com.au/20230821/aussie-dollar-flashes-warning-signal.html
A2 Milk — ‘a broad range of sales outcomes is possible’
What would you make of a company’s prospects if it issued an outlook statement saying ‘a broad range of sales outcomes is possible’?
Theoretically, it is true.
Look far ahead, and a range of outcomes is possible.
But you expect businesses to have a clearer vision that narrows the range of these outcomes.
Not so for A2 Milk’s management.
FY24 is giving the infant formula trouble. It can’t winnow the possible outcomes to an actionable — or reassuring range.
A2 Milk said challenging market conditions are clouding its crystal ball. Nonetheless, management thinks revenue will grow by ‘single digits’.
$A2M: 'a broad range of sales outcomes is possible'. #A2M #A2Milk #ASX pic.twitter.com/zufoWOVDVL
— Fat Tail Daily (@FatTailDaily) August 21, 2023
A2 Milk down 12% on FY23 results
Dairy nutrition company A2 Milk [ASX:A2M] is down 12% in early trade on Monday after reporting full-year results in line with guidance.
- Revenue up 10.1% to $1.6 billion
- EBITDA up 11.8% to $219.3 million
- Net profit after tax up 26.9% to $155.6 million
- Net cash down 7.3% to $757.2 million
While FY23 results were in line with guidance, A2 Milk’s FY24 outlook is probably what spooked investors.
A2M said the China market is ‘likely to become more challenging in FY24 with a further double-digit decline in market value expected’.
A2 Milk identified two reasons:
- China’s declining birthrate: “volume declines driven by the rolling impact of fewer newborns in recent years on later stage IMF products, and a lower number of newborns expected in CY23 due to the lagged impact of COVID-19 prior to an expected increase in CY24.”
- Margin pressure due to competition: “average selling prices will remain under pressure due to an increase in competitive intensity driven by the market-wide transition to new GB product, excess manufacturing capacity and challenging macroeconomic conditions.”
$A2M issues sombre FY24 outlook, with a 'broad range of sales outcomes possible'.
'At this stage,' #A2M expects 'low single-digit revenue growth in FY24'. #ASX $A2M.AX pic.twitter.com/Vy2NZA3yy7
— Fat Tail Daily (@FatTailDaily) August 21, 2023
Are iron ore stocks in structural decline?
In case you missed it, here’s the latest What’s Not Priced In episode, where we talk about China, spillover effects, and iron ore stocks.
Here’s the write-up with the link to the episode!
https://www.moneymorning.com.au/20230818/asx-iron-ore-stocks-in-structural-decline.html
Good morning and a quick market recap
Good morning, all.
Welcome to the ASX live blog.
Another busy day today.
Here’s an espresso-sized market recap.
Stocks worldwide had their biggest weekly drop since March last week on worries about higher for longer interest rates and slower growth from China.
The S&P 500 fell 2.1% last week and the Nasdaq fell 2.6%.
As for the Aussie market, the ASX 200 had its worst week since September last year, down 2.6%.
The Financial Times reported that the ‘Magnificent Seven’ US tech stocks — Alphabet, Amazon, Apple, Meta, Microsoft, Nvidia and Tesla — lost more than a combined US$900 billion over three straight weeks of declines.
Hefty!

Footer
Fat Tail Daily is brought to you by the team at Fat Tail Investment Research
Copyright © 2026 Fat Tail Daily | ACN: 117 765 009 / ABN: 33 117 765 009 / ASFL: 323 988