ASX LIVE | ASX Rebounds; Weaker Oil and Jobs Data Calms Equity Markets
Market Close update
ASX 200 closed up 0.51% at 6,925.5, recovering from a week of downward trends. The ASX 200 benchmark is still down for 2023 YTD (-1.61%) with the majority of the losses seen in the past month, which has wiped -5.37% off the index.
Only Energy (-0.89%) Discretionary (-0.30%), and Materials (-0.16%) were the sectors in the red at close today with the biggest gainers in Real Estate (+2.10%), and Info Tech (+1.73%)
What’s going on in bond markets? a simpler explainer
The world of fixed-income securities like bonds is an arcane one. The range of knowledge traders have in this space varies, so we’ll look at this in somewhat simplified terms.
Since the beginning of August, we have seen bond prices fall along with stock markets. But what does this mean?
A fall in bond prices means that bond yields rise.
What are bond yields?
A bond is a form of loan that investors make to a borrower or bond issuer. Governments, companies and other organisations issue them to raise money. The bond market is the biggest securities market in the world, worth almost US$130 trillion.
The US bond market is the largest, accounting for about 40% of debt worldwide.
Bond yields represent the amount of money an investor receives for owning the debt as a percentage of its current price. When the price of a bond falls, yields rise. The yield can also be seen as the ‘cost of borrowing’ to an issuer.
So when you hear bond yields are rising, like we have seen recently, with 10-year treasury bond yields hitting 16-year highs, you can also interpret that as bond prices collapsing.
In the US, the bond market has been in a drawdown for 38 months, by far the longest bond bear market in history.

Source: Zerohedge
Tiny bit of history
This has been gaining so much coverage because we are moving into technical positions not seen since the economic meltdown of 1981-2. This downturn was triggered by tight monetary policy, which was in place to battle inflation (sound familiar).
The history books focus on this period for the famous Fed governor Paul Volcker, who was known for his dogged view on controlling inflation over all other concerns.
As he said in ’76: ‘In terms of economic stability in the future, [inflation] is what is likely to give us the most problems and create the biggest recession’.
He followed through on this, surprising the market with a similar call to today, with ‘higher [interest rates] for longer‘ and more aggressive monetary control than investors expected.
As he put it, a ‘failure to carry through now in the fight on inflation will only make any subsequent effort more difficult.’
This led him to put through a series of aggressive monetary policy measures known as ‘Volcker Shock’.
While painful for the economy, it brought inflation from over 14% in 1980 to 3% in 1983.
Back to the Present
This year, bond yields have been rising sharply in 2023 (remember, this means bond prices are collapsing) as investors anticipate that central banks worldwide will continue to hike interest rates in an effort to combat inflation.
The yield on the 10-year US Treasury note, which is a benchmark for global bond yields, has risen from around 3.8% at the beginning of the year to over 4.8% overnight.
It has since eased slightly to 4.73%, but the last time we saw bond yields at 4.7% was in 2007 — another auspicious year.
There are a few factors driving the rise in bond yields. First, the Federal Reserve has been raising interest rates aggressively in an effort to bring inflation down from the 40-year high we saw earlier in the year.
The Fed has raised interest rates to a peak of 5.25−5.5% so far this year and has hinted that it could raise again. While many aren’t convinced, the ‘higher for longer’ threats have been taken seriously.
Investors are becoming more concerned about the risk of a recession. The global economy is holding up, but there are still chances we could fall into a recession — why or when we couldn’t guess.
Regardless of the reason, investors have a falling appetite for holding long-term bonds when there is a perceived growing risk of long-term default for economies or national finances.
As a result, investors demand higher compensation for lending money for longer periods of time. This is known as the term premium, and it has been rising in recent months as investors become more uncertain about the future economic outlook.
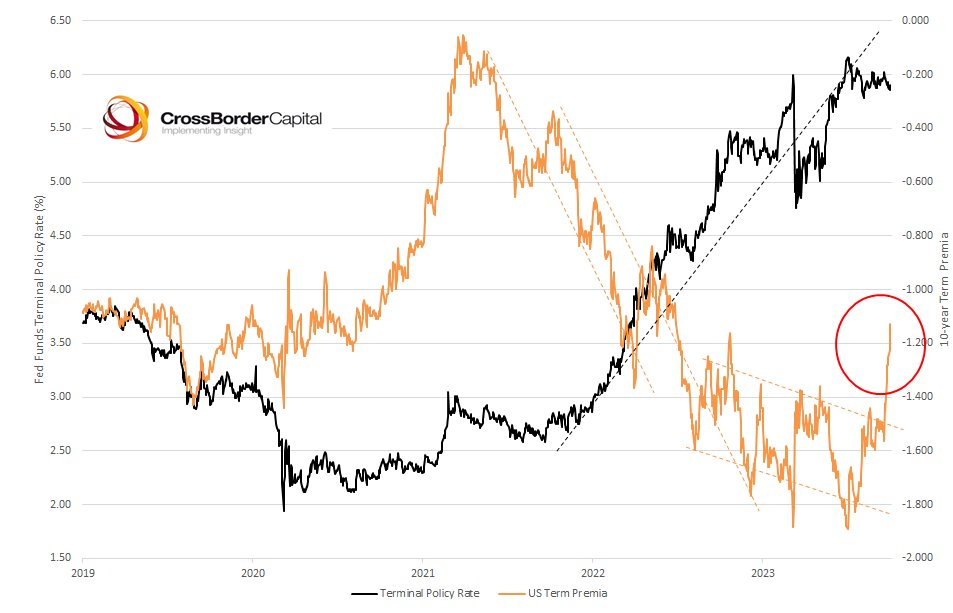
Source: CrossBorder Capital
Here, we can see that the term premium (in orange) has risen rapidly in recent weeks as concerns about the future have grown under the new ‘higher for longer’ rhetoric since the September Fed meeting.
To confuse the situation, some of the reasons for the Fed’s reasons for the ‘higher for longer’ regime are in part thanks to the resilience of the US economy. Job numbers have held higher than many were expecting, and this strength, combined with rising oil prices, raised concerns of ‘embedded inflation‘.
This pushed the Fed under Jerome Powell into a similar position to Paul Volcker in the 80s. After not believing his speeches until September, the market now believes his rhetoric and is reacting, sending bond yields to historic highs.
What do these rising bond yields mean?
The rise in bond yields has had several consequences. First, it has made borrowing money more expensive for governments and businesses. This could lead to slower economic growth in the future.
To try to raise money, the government will have to sell bonds (and has been) with higher yields in order to make them attractive to cautious investors, meaning the ‘cost of borrowing‘ for governments goes up.
In 2022, it cost the US government $476 billion, or around 2% of the national GDP, to pay its interest. With higher interest rates and rising yields, this is predicted to reach 4% of GDP by 2030.
Another impact of the rise in bond yields has been a sell-off in stocks. This is because stocks and bonds are often seen as competing asset classes. When bond yields rise, stocks become less attractive to investors.
The rise in bond yields has made existing bonds less valuable. This is because investors can now buy new bonds with higher yields. This has led to significant losses for bond investors or holders.
What is interesting about this fact is that government regulation and financial prudence by many institutional investors mean they usually hold large quantities of bonds as a safe asset or hedge against losses in other equities.
A good example of this is banks, where many are forced to hold capital as security. This security is held as bonds with a very long maturity, the kind that is becoming worthless in the changing bond landscape.
Small US banks hold about $900 billion of treasuries. As yields have been surging continually, unrealised losses on banks’ balance sheets have continued to accumulate. If this continues, we’ll likely see more stress in the financial system and probably even more bank failures.
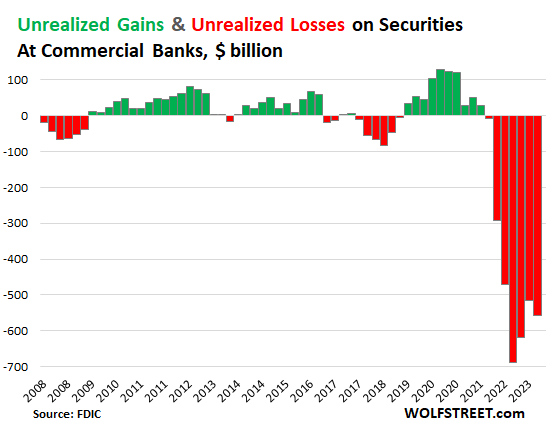
Source: Wolfstreet.com
The US does have systems to try to relieve this pressure, such as the Bank Term Funding Program, which was set up after the sudden failure of smaller banks, but the pressure is still on.
That pressure could mean companies are unwilling to borrow and invest, and countries tighten budgets and pull in spending, leading to an eventual slowdown of the economy.
And that’s a simplified update on where we are at. Bonds have eased slightly overnight— as have oil prices — but these bonds are still putting pressure on many parts of the system.
What’s going on in bond markets? a simpler explainer
The world of fixed-income securities like bonds is an arcane one. The range of knowledge traders have in this space varies, so we’ll look at this in somewhat simplified terms.
Since the beginning of August, we have seen bond prices fall along with stock markets. But what does this mean?
A fall in bond prices means that bond yields rise.
What are bond yields?
A bond is a form of loan that investors make to a borrower or bond issuer. Governments, companies and other organisations issue them to raise money. The bond market is the biggest securities market in the world, worth almost US$130 trillion.
The US bond market is the largest, accounting for about 40% of debt worldwide.
Bond yields represent the amount of money an investor receives for owning the debt as a percentage of its current price. When the price of a bond falls, yields rise. The yield can also be seen as the ‘cost of borrowing’ to an issuer.
So when you hear bond yields are rising, like we have seen recently, with 10-year treasury bond yields hitting 16-year highs, you can also interpret that as bond prices collapsing.
In the US, the bond market has been in a drawdown for 38 months, by far the longest bond bear market in history.
Source: Zerohedge
Tiny bit of history
This has been gaining so much coverage because we are moving into technical positions not seen since the economic meltdown of 1981-2. This downturn was triggered by tight monetary policy, which was in place to battle inflation (sound familiar).
The history books focus on this period for the famous Fed governor Paul Volcker, who was known for his dogged view on controlling inflation over all other concerns.
As he said in ’76: ‘In terms of economic stability in the future, [inflation] is what is likely to give us the most problems and create the biggest recession’.
He followed through on this, surprising the market with a similar call to today, with ‘higher [interest rates] for longer‘ and more aggressive monetary control than investors expected.
As he put it, a ‘failure to carry through now in the fight on inflation will only make any subsequent effort more difficult.’
This led him to put through a series of aggressive monetary policy measures known as ‘Volcker Shock’.
While painful for the economy, it brought inflation from over 14% in 1980 to 3% in 1983.
Back to the Present
This year, bond yields have been rising sharply in 2023 (remember, this means bond prices are collapsing) as investors anticipate that central banks worldwide will continue to hike interest rates in an effort to combat inflation.
The yield on the 10-year US Treasury note, which is a benchmark for global bond yields, has risen from around 3.8% at the beginning of the year to over 4.8% overnight.
It has since eased slightly to 4.73%, but the last time we saw bond yields at 4.7% was in 2007 — another auspicious year.
There are a few factors driving the rise in bond yields. First, the Federal Reserve has been raising interest rates aggressively in an effort to bring inflation down from the 40-year high we saw earlier in the year.
The Fed has raised interest rates to a peak of 5.25−5.5% so far this year and has hinted that it could raise again. While many aren’t convinced, the ‘higher for longer’ threats have been taken seriously.
Investors are becoming more concerned about the risk of a recession. The global economy is holding up, but there are still chances we could fall into a recession — why or when we couldn’t guess.
Regardless of the reason, investors have a falling appetite for holding long-term bonds when there is a perceived growing risk of long-term default for economies or national finances.
As a result, investors demand higher compensation for lending money for longer periods of time. This is known as the term premium, and it has been rising in recent months as investors become more uncertain about the future economic outlook.
Source: CrossBorder Capital
Here, we can see that the term premium (in orange) has risen rapidly in recent weeks as concerns about the future have grown under the new ‘higher for longer’ rhetoric since the September Fed meeting.
To confuse the situation, some of the reasons for the Fed’s reasons for the ‘higher for longer’ regime are in part thanks to the resilience of the US economy. Job numbers have held higher than many were expecting, and this strength, combined with rising oil prices, raised concerns of ‘embedded inflation‘.
This pushed the Fed under Jerome Powell into a similar position to Paul Volcker in the 80s. After not believing his speeches until September, the market now believes his rhetoric and is reacting, sending bond yields to historic highs.
What do these rising bond yields mean?
The rise in bond yields has had several consequences. First, it has made borrowing money more expensive for governments and businesses. This could lead to slower economic growth in the future.
To try to raise money, the government will have to sell bonds (and has been) with higher yields in order to make them attractive to cautious investors, meaning the ‘cost of borrowing‘ for governments goes up.
In 2022, it cost the US government $476 billion, or around 2% of the national GDP, to pay its interest. With higher interest rates and rising yields, this is predicted to reach 4% of GDP by 2030.
Another impact of the rise in bond yields has been a sell-off in stocks. This is because stocks and bonds are often seen as competing asset classes. When bond yields rise, stocks become less attractive to investors.
The rise in bond yields has made existing bonds less valuable. This is because investors can now buy new bonds with higher yields. This has led to significant losses for bond investors or holders.
What is interesting about this fact is that government regulation and financial prudence by many institutional investors mean they usually hold large quantities of bonds as a safe asset or hedge against losses in other equities.
A good example of this is banks, where many are forced to hold capital as security. This security is held as bonds with a very long maturity, the kind that is becoming worthless in the changing bond landscape.
Small US banks hold about $900 billion of treasuries. As yields have been surging continually, unrealised losses on banks’ balance sheets have continued to accumulate. If this continues, we’ll likely see more stress in the financial system and probably even more bank failures.
Source: Wolfstreet.com
The US does have systems to try to relieve this pressure, such as the Bank Term Funding Program, which was set up after the sudden failure of smaller banks, but the pressure is still on.
That pressure could mean companies are unwilling to borrow and invest, and countries tighten budgets and pull in spending, leading to an eventual slowdown of the economy.
And that’s a simplified update on where we are at. Bonds have eased slightly overnight— as have oil prices — but these bonds are still putting pressure on many parts of the system.
Westgold Resources [ASX:WGX] affirms 2024 guidance
Westgold Resources [ASX:WGX] shares are up by 2.86% today, trading at $1.62 per share, after affirming its FY24 production guidance and releasing preliminary results from this quarter.
Westgold produced 63,104 ounces of gold from its Murchison and Bryah Operations in WA, achieving an average gold sale price of $2,888/oz
The company’s cash, bullion and liquid assets at the end of Q1 rose by $25 million, taking the group to $217 million.

Source: Westgold
Westgold Managing Director Wayne Bramwell commented on the news today:
‘Corporately, the completion of our fixed forward sales program in July saw us realise the full value of the Australian dollar gold price in August and September for the first time. Our operational performance was pleasing and with positive cash build for a third consecutive quarter, Westgold has set the foundation to deliver its FY24 guidance. Looking forward, Q2 will mark the first full quarter with cash flows unimpeded by fixed forward contracts. We can fund our exciting suite of internal growth options from operating cashflows and see opportunities such as Great Fingall as heralding a new stage of Westgold’s transformation into a progressive and more profitable Australian gold miner.’
Westgold Resources [ASX:WGX] affirms 2024 guidance
Westgold Resources [ASX:WGX] shares are up by 2.86% today, trading at $1.62 per share, after affirming its FY24 production guidance and releasing preliminary results from this quarter.
Westgold produced 63,104 ounces of gold from its Murchison and Bryah Operations in WA, achieving an average gold sale price of $2,888/oz
The company’s cash, bullion and liquid assets at the end of Q1 rose by $25 million, taking the group to $217 million.
Source: Westgold
Westgold Managing Director Wayne Bramwell commented on the news today:
‘Corporately, the completion of our fixed forward sales program in July saw us realise the full value of the Australian dollar gold price in August and September for the first time. Our operational performance was pleasing and with positive cash build for a third consecutive quarter, Westgold has set the foundation to deliver its FY24 guidance. Looking forward, Q2 will mark the first full quarter with cash flows unimpeded by fixed forward contracts. We can fund our exciting suite of internal growth options from operating cashflows and see opportunities such as Great Fingall as heralding a new stage of Westgold’s transformation into a progressive and more profitable Australian gold miner.’
Current market cycle opens opportunity
When markets look shakey, you’ll find our endless optimist and shark stock picker, Callum Newman, outlining the opportunities that can be found in small-caps.
As he says:
‘The Aussie small-cap sector has been under the pump since about September 2021. That’s two years ago.
Some of these stocks have been hammered and trading in them has almost dried up completely.
There’s no ‘blue sky’ thinking going on here.
In fact, it’s the complete reverse. You can pick some of them up at incredibly low valuations.
Even when we get big down days, some of the small-cap stocks are not reacting down much.
The day traders and the pipe dreamers and the speculators are long gone.
This gives these stocks a solid base of long-term holders now.
Professional money will begin to accumulate in select names because there is so much value on offer.’
Click below to read on.
https://www.moneymorning.com.au/20231005/your-chance-to-buy-low-and-sell-high.html
Midday market update
The ASX 200 fell back to near flat at midday, up only 0.10% at 6,896.8 as the Energy (-2.07%) Sector dragged the market down, while gold prices and miners recovered as some of the pressure was relieved from the bond markets overnight.
The worst performers for midday are:
- Core Lithium -5.06%
- Sayona Mining -4.3%
- IGO -3.9%
- Viva Energy Group -3.67%
- Karoon Energy -3.33%
On the positive side:
- Weebit Nano +3.69%
- Northern Star +3.00%
- Bellevue Gold +2.81%
- Vicinity Centres +2.40%
- Qantas +2.33%
Oil Prices fall over 5% in biggest one-day drop in over a year
Oil prices collapsed overnight, dropping over $5 per barrel over collective concerns about increased borrowing costs caused by ‘higher for longer’ interest rates, eventually deflated oil’s march towards $100 per barrel.
Brent crude, the global benchmark price, fell 5.6% to $85.90 per barrel, its biggest one-day fall since August 2022.
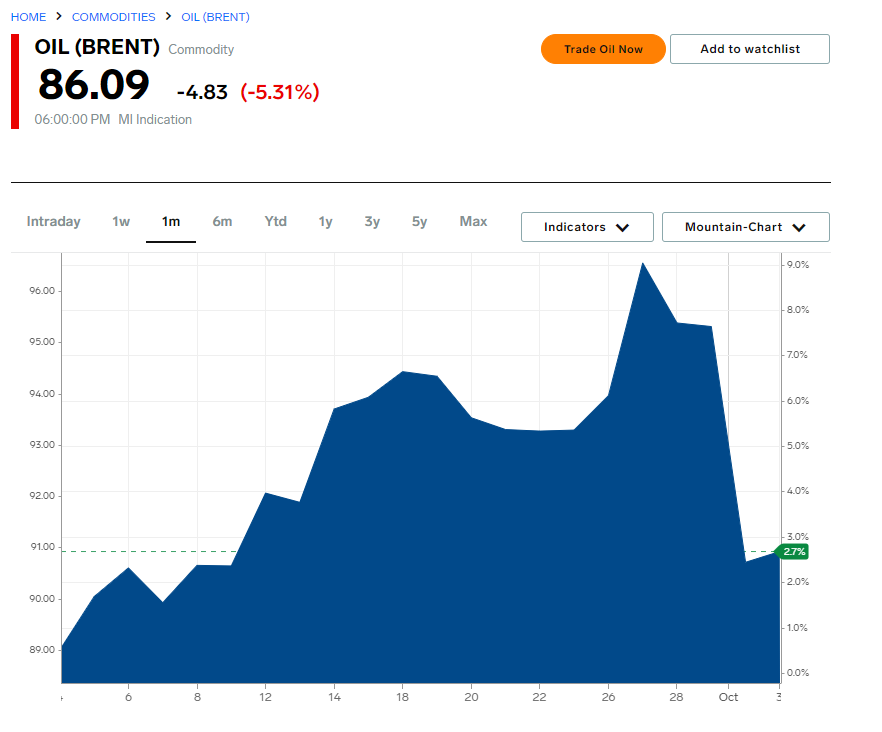
Source: MarketInsider
Meanwhile, West Texas Intermediate (WTI) fell to similar levels, falling 5.6% to $84.22.
The surprise sharp decline came as the market swung against surging interest rates and climbing bond yields.
In a sharp change from sentiment where traders were expecting $100 per barrel just last week, we saw a sentiment shift after the US Energy Information Administration reported overnight that domestic petrol stocks rose by 6.5 million barrels last week. In comparison, inventories of crude fell by 2.2 million barrels.
Refineries were attempting to capitalise on the high fuel prices and overproduced petrol in hopes of big profits. However, price inelasticity by consumers (the thing we have been talking about recently) eventually stung, and seasonal gasoline demand hit lows not seen since 1998.
Commitments by Russia and Saudi Arabia to continue production cuts weren’t enough to stop prices from collapsing overnight.
As a result, the Energy Sector, both here and in the US, is taking a beating. The ASX 200 Energy benchmark is down 2.43%
Woodside Energy [ASX:WDS] is down 2.26%, Santos [ASX:STO] is down 2.15%, and Viva Energy [ASX:VEA] is down 3.15%.
Oil Prices fall over 5% in biggest one-day drop in over a year
Oil prices collapsed overnight, dropping over $5 per barrel over collective concerns about increased borrowing costs caused by ‘higher for longer’ interest rates, eventually deflated oil’s march towards $100 per barrel.
Brent crude, the global benchmark price, fell 5.6% to $85.90 per barrel, its biggest one-day fall since August 2022.
Source: MarketInsider
Meanwhile, West Texas Intermediate (WTI) fell to similar levels, falling 5.6% to $84.22.
The surprise sharp decline came as the market swung against surging interest rates and climbing bond yields.
In a sharp change from sentiment where traders were expecting $100 per barrel just last week, we saw a sentiment shift after the US Energy Information Administration reported overnight that domestic petrol stocks rose by 6.5 million barrels last week. In comparison, inventories of crude fell by 2.2 million barrels.
Refineries were attempting to capitalise on the high fuel prices and overproduced petrol in hopes of big profits. However, price inelasticity by consumers (the thing we have been talking about recently) eventually stung, and seasonal gasoline demand hit lows not seen since 1998.
Commitments by Russia and Saudi Arabia to continue production cuts weren’t enough to stop prices from collapsing overnight.
As a result, the Energy Sector, both here and in the US, is taking a beating. The ASX 200 Energy benchmark is down 2.43%
Woodside Energy [ASX:WDS] is down 2.26%, Santos [ASX:STO] is down 2.15%, and Viva Energy [ASX:VEA] is down 3.15%.
Australia’s Balance of trade expands
Australia’s trade surplus expanded $9.6 billion in August, beating expectations of $8.7 billion
Exports gained 4%, pushed by gold exports, while imports declined 0.4% as industrial intermediates like transport equipment fell.
The implications of this trade surplus expansion for the Australian economy are generally positive. A trade surplus means that Australia is exporting more goods and services than it is importing, which can boost economic growth and jobs. It can also improve Australia’s balance of payments, which can make the Australian dollar more attractive to foreign investors.
This could also help our weak Aussie dollar, which has been under pressure recently thanks to US Treasury yields pushing up the USD as those bonds become attractive to foreign buyers who purchase them with USD.
Newcrest Mining [ASX:NCM] announces special dividend
Australian gold producer Newcrest Mining [ASX:NCM] announced a fully franked special dividend of US$1.1 today.
Shares of the producer are up by 0.59% this morning, trading at $24.01 per share as gold prices recover from being oversold after a slight easing of Treasury yields overnight.
This will be separate from the Dividend Reinvestment Plan, which was suspended in August.
Market open
- ASX 200 up 0.26% 6,908.1
- $AUD up +0.46% at 63.29 US cents
- ASX futures down -0.29% to 6,943.5
- S&P 500 up +0.81%
- NASDAQ up +1.35%
- DOW up +0.39%
- FTSE down -0.77%
- STOXX flat -0.04%
- SSE up +0.10%
- Bitcoin up +1.27% to $US 27,799.25
- Spot gold flat +0.02% to $US 1,824.01
- Iron ore down -1.42% to $US 118.44
- Brent Crude down heavily -5.31% to $US 86.09pb
All figures shown are from 10:40am AEST
Good morning
Good morning,
It was a busy night on the markets overnight; let’s get into it.
Treasury yields fell from a 16-year high after the monthly ADP private payrolls report showed slowed job hiring. This signalled a slowing US economy that raised hopes to traders that the slowdown would be enough for the Federal Reserve to keep rates on hold next month.
Yields on US 10-year treasuries are down -6 basis points to 4.73%
Meanwhile, the Australian 10-year treasury bonds climbed four basis points to 4.58%
Equity markets breathed a sigh of relief at the easing bond yields and bounced overnight, with all of Wall Street up or closing flat.
S&P 500 (+0.81%), DOW (+0.39%), Nasdaq (+1.35%)
Meanwhile, the CNN Fear Index eased slightly overnight, moving from 17 ‘extreme fear’ back to 19, showing that markets are still very wary of the Feds next move in this ‘higher for longer‘ environment. It seemed that for months, traders have not believed that the Fed would hold rates for as long as it had said, with many pricing in cuts as soon as the end of this year.
Now that markets have internalised interest rates this high until late next year (or recession bites, forcing a cut), traders are wary.
Due to weak US data, oil fell over 5% in the biggest one-day drop in over a year.
US Retail Gasoline seasonal demand fell to the lowest levels since 1998. US crude inventories continue to fall, down -2.22 million barrels this month, signalling refineries had been focusing on gasoline production to capitalise on higher prices. Now, it seems consumers are feeling the pinch and cutting back.
Saudi Arabia and Russia announced they intend to continue their 1m barrels a day of voluntary cuts over the standing OPEC+ reductions.
Cuts have been reaffirmed by both countries, who say they will continue the cuts until at least the end of the year.

Footer
Fat Tail Daily is brought to you by the team at Fat Tail Investment Research
Copyright © 2026 Fat Tail Daily | ACN: 117 765 009 / ABN: 33 117 765 009 / ASFL: 323 988