
A couple of weeks ago, investment bank Jarden revised its property market forecast of a peak-to-trough fall in national median dwellings values from 15–20% — now suggesting property prices could plummet by as much as 20–25% as interest rates continue to rise.
‘“We believe the RBA’s hawkish shift risks up-ending this budding optimism, seeing prices decline further,” they wrote. “Indeed, we now see too much downside risk to our long-held forecast of a 15-20% peak-to-trough fall in house prices and downgrade to a 20-25% correction.”’
The revised forecast would equate to a 15% fall in the national median through 2023. If it occurred, it would make it the largest 12-month drop in median values on record.
It makes a good headline for the mainstream — and I’m not saying it can’t happen. Changes to government and monetary policies always have the potential to interrupt the cycle locally.
The official cash rate is now 3.35%. Nationally, values are down 7.2%. The most extreme falls have been felt in Sydney, where their median has fallen slightly more than 13%.
That’s a sharp downturn, although it’s worth noting at this point that Perth, Adelaide, and Darwin are still firmly in positive territory! When I talk to agents on the ground in WA, they ask me, ‘what downturn!?’
Still, despite all the above, as it stands right now, there are a few indicators that show we’re not facing the doom and gloom that’s being peddled by the majors — including investment bank Jarden.
In fact, if anything, it looks like the market could plateau out in the months ahead.
Since mid-2022 (no matter which data agency you follow), clearance rates have tightened.
Sydney’s preliminary clearance rates (as recorded by Domain) have been pushing into the 70s. That’s a marked increase from last year.
There’s a lot of huff and puff about clearance rates being overinflated due to agent misreporting — and those arguments carry credence. There’s always a significant number of results missing from the data.
However, despite this, shifts in the auction clearance rate have always been a leading indicator of changes to median prices. They give a solid indication of the heat in the market. If the CR continues to hold at higher levels, prices should start to push into positive territory later this year.
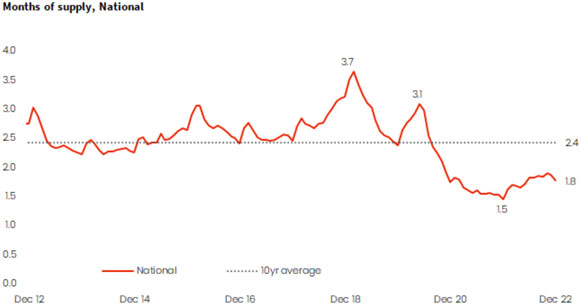
Stock on the market remains low, and there’s no indication of a flood of new listings to tip the balance of supply and demand.
|
|
| Source: CoreLogic |
Through the December quarter last year, the number of home sales was estimated to be 27.3% lower than at the same time in 2021 and 6.6% below the previous five-year average.
Pre-listing activity by real estate agents across CoreLogic’s RP Data platform is 15.3% lower compared to the same period a year ago.
If nothing else, it indicates there is some confidence from vendors that prices won’t fall too much further. There is little rush to sell in fear of a depreciating market.
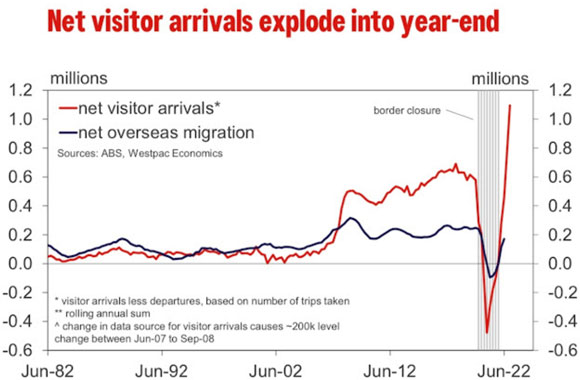
The government has lifted the overseas migration target from 160,000–200,000 per annum, and immigration is rocketing to record levels.
That’s going to increase pressure on existing housing significantly — especially in Sydney and Melbourne, where the bulk of new migrants are flowing.
As noted in Westpac’s recent report:
|
|
| Source: Westpac |
|
|
| Source: Westpac |
On the ground, not only are there not enough properties for long-term lease to moderate rental rises with record low vacancy rates nationwide — but now there’s a hint that, in some areas, there may not be enough stock on the market to meet any increase in buyer demand.
Already we’re seeing queues of people outside some open for inspections in Sydney.
Just take a look at some of the headlines from the last couple of weeks:
|
|
| Source: Daily Telegraph |

|
|
| Source: Domain |

Considering all the above, it’s not surprising that the latest CoreLogic data shows that the Home Price Index fell 0.1% nationally in February. That’s the smallest fall since May 2022. Furthermore, sydney home values actually rose for the first month since January 2022!
It chimes with the forecasts given by the founder of SQM Research, Louis Christopher, in his ‘Christopher’s Housing Boom and Bust Report 2023’ released late last year.
You may recall I interviewed Louis just as he was releasing the report.
Louis’ base case for 2023 is that Sydney and Perth would lead national property prices out of a decline, showing a modest recovery by the second half of 2023.
|
|
| Source: SQM Research |
‘I believe the markets can recover, and they’ve been showing some signs of recovery, such as the modest rise in auction clearance rates and asking prices, even while we’ve had these cash rate increases…..given the surge in the economy that accelerated wage increases, I believe that will create grounds for a housing market recovery, ]or at the very least, a situation where the housing market would stop falling.
‘Sydney is expected to lead the recovery driven by the surge in underlying demand for residential property and its diverse economy…
‘Sydney is capturing the lion’s share of net overseas arrivals, people are coming back from the regions and returning into the office environment and the taxation changes made by the NSW government will encourage first-time buyer activity.’
Louis Christopher
Early indicators certainly suggest Louis’ base case could be playing out. However, as per his recent comments on Twitter, there’s still a lot of uncertainty to navigate.
|
|
| Source: Twitter |

Housing turnover a leading recessionary indicator…
For now, however, before we fully acknowledge a turn, we need to keep an eye on housing turnover.
As a percentage of total housing stock, it’s currently falling.
Take a look:
|
|
| Source: CoreLogic |
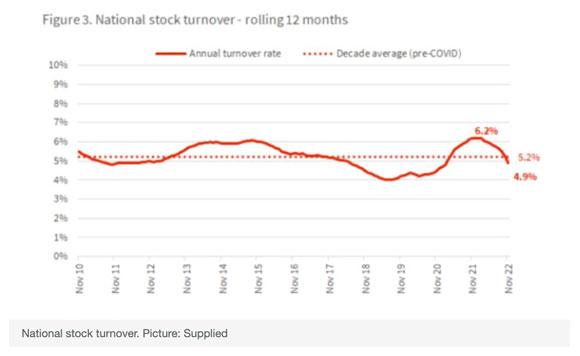
In other words, there’s a reduced number of buyers in the market, which has a roll-on effect to the FIRE sector (finance, insurance, and real estate), which accounts for a large proportion of the economy.
This is why housing turnover is a leading recessionary indicator.
We use this metric to construct the Kavanagh/Puntland (KP) Index.
The KP Index forms part of the research we conduct at Prosper Australia.
It has proven to be a very reliable indicator of economic recessions some 12–18 months in advance.
It focuses on the total value of transactions (basically monitoring people’s ability to access credit and buy).
The index charts the total value of Australian real estate sales to GDP.
In other words, the more dollars we pour into land speculation, the less we have to spend on the productive sectors of the economy, of which GDP gives some indication.
It is this that provides a better indication of the overall health of the market and economy than median price data, clearance rates, or whether the RBA will raise the cash rate by 25 basis points or 50 basis points.
Especially so in a country where the financial system is reliant on property prices going up, and policymakers put an overreliance on the so-called ‘wealth effect’.
|
|
| Source: Prosper Australia |
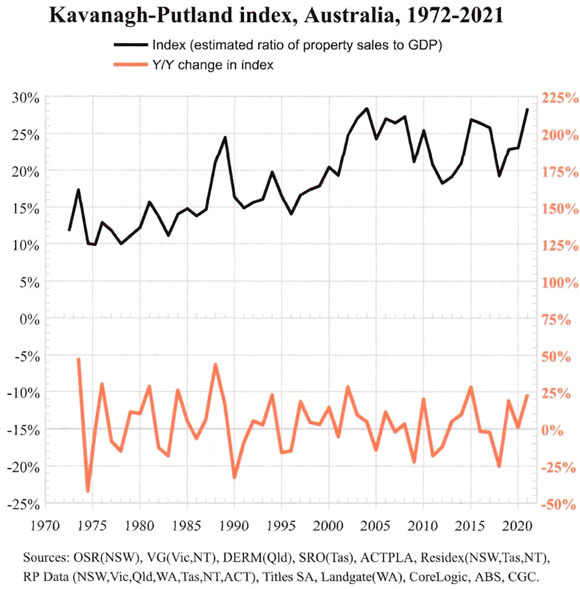
As mentioned, the KP Index shows that recessions usually occur within 12–18 months of the year-on-year index declining by 25% or more (noted from the right-hand axis).
|
|
| Source: Prosper Australia (Edited by Catherine Cashmore) |
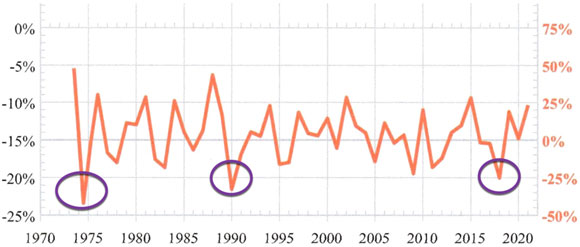
You can see it did this prior to the 1970s and 1990s recessions.
It did so again in mid-2018 — pointing toward recession at the end of 2019 and the beginning of 2020 — the mid cycle.
Right now, the index doesn’t give any indication of a looming recession. However, we’ll update the data in March and will have a clearer picture following.
Sales turnover is not as bad as it was in 2018 when buyer demand tanked due to tighter lending standards resulting from the Banking Royal Commission. So when we do update the chart, I don’t expect any change to the overall forecast just yet.
However, if the updated chart in March shows otherwise, it could indicate an earlier peak to the cycle than expected.
I’ll bring you the data as soon as it’s been correlated.
Right now, however, I am speculating that buyer demand will increase in the months ahead.
Why so, considering rates are forecast to rise even further?
Well, news that APRA is likely to reduce the so-called serviceability buffers and allow borrowers to get bigger loans — when it releases a review of its housing market lending rules within the next fortnight is one major reason.
If it does this, prices will increase simply because buyers will have access to bigger loans.
And if prices do increase, you can bet buyer demand will turn alongside it.
No one wants to buy into a market that could potentially fall further.
But once that changes, we should be entering a strong inflationary run that will take us right to the peak in 2026.
Time will tell.
Sincerely,
 |
Catherine Cashmore,
Editor, Land Cycle Investor

Comments