
Earlier this year, Ray Dalio (billionaire investor and founder of Bridgewater Associates) wrote an article titled ‘Where We Are in the Big Cycle: On the Brink of a Period of Great Disorder’.
It’s almost six months since Dalio alerted us to the imminent danger ahead.
Now, with long dated US Treasury Bond (10-year and 30-year) yields moving to higher levels, we’re approaching the brink.
In an interview last week with CNBC, Ray Dalio warned of a pending debt crisis
(emphasis added)…
‘Billionaire investor Ray Dalio is watching closely the “risky” U.S. fiscal situation.
“We’re going to have a debt crisis in this country,” the founder of hedge fund Bridgewater Associates said in an interview with CNBC’s Sara Eisen that aired Thursday.‘The two were speaking at a fireside chat at the Managed Funds Association. “How fast it transpires, I think, is going to be a function of that supply-demand issue, so I’m watching that very closely.”
‘U.S. debt levels surpassed $33 trillion for the first time this month as lawmakers negotiate a U.S. spending bill before the Oct. 1 deadline. A failure to reach an agreement could mean a government shutdown and raise the perceived risk of the country’s debt.’
A stay of execution on a US government shutdown was reached…but, only for the next 45 days. Political gridlock continues. The debt keeps mounting. And interest rates show no signs of retreat.
But does anyone in the street really notice this stuff?
Not really.
Why?
Because in our minds ‘life goes on like it always has’, so why sweat the small stuff?
Well, this ain’t the small stuff, this is…HUGE.
We’re on the brink of a period of significant dislocation.
In the 20th century there were two periods of contrasting social and financial conditions.
The first was when The Roaring Twenties gave way to The Depressing Thirties.
The other one was after The Second World War.
Let’s travel back to a time when life was a little less complex.
To an era when markets were free to be markets…a time when the scales of price discovery were not overtly distorted by the heavy hand of central bankers.
Post-Second World War prosperity
After The Second World War, the US knuckled down to the business of rebuilding its economy.
Energy costs low.
Lots of babies were born.
Homes constructed.
Whitegoods and automobiles were in demand.
Consumers were awakened from two decades of slumber…but, with the lessons of The Great Depression still fresh, credit was used with caution.
All in all, the middle class prospered in an era of high productivity and shared prosperity.
From the Wikipedia page ‘Economic History of the United States Post-World War II’…
‘The period from the end of World War II to the early 1970s was a golden era of [US] economic growth. $200 billion in war bonds matured, and the G.I. Bill financed a well-educated workforce. The middle class swelled, as did GDP and productivity. This growth was distributed fairly evenly across the economic classes…’
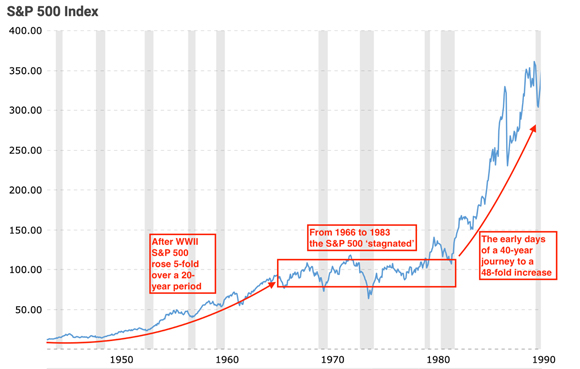
Wall Street reflected these prosperous conditions. From 1945 to 1966, the S&P 500 increased five-fold.
|
|
| Source: MacroTrends |
But, as they say in the classics, ‘all good things come to an end’.
The cycle turned in the late 1960s/early 1970s.
Inflation. The ‘temporary’ removal of the gold standard. Oil crises.
All these factors combined to put the S&P 500 into a sideways (zigging and zagging) holding pattern for the next 17 years.
Then came the next period of (artificial) prosperity
In the early 1980s, with confidence in equity investments at its lowest ebb, the seemingly grounded S&P500 taxied down the runway and took flight on a four-decade (and at times, bumpy) journey to an unimagined height…peaking around 4,800 points in January 2022.
When measured against the S&P’s post-Second World War decade, five-fold gain (achieved against a backdrop of genuine prosperity garnered from real advancements in productivity), you can appreciate just how astonishing this 40-year (1983 to 2023) 48-fold gain has been (achieved not from productivity gains or shared prosperity, but from a never-ending supply of credit).
Since 1983, Total US Debt has increased by a whopping…US$90 trillion.
|
|
| Source: FRED |

Amassing debt on this scale was made possible by a 40-year downward trend in cash and bond interest rates…
|
|
| Source: FRED |
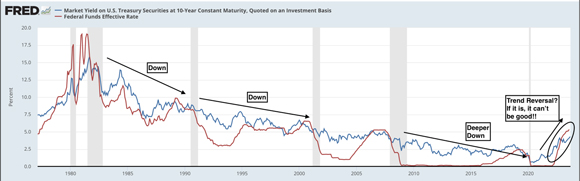
These two charts tell the story of what propelled (an unprecedented level of) asset price appreciation during our adult (investing) lifetime.
However, it appears the 40-year downward pressure on cash and bond rates has reversed.
Is this a permanent trend change or will interest rates once more be pushed by central bankers to the zero line?
Best guess is it’s a trend change…
Why?
- Higher energy costs feeding into higher inflation and cost of living pressures.
- Triggering more wage demands…feeding into a higher inflationary loop.
- The breakdown in globalisation…China’s role as the low inflation exporter to the developed world, is diminishing.
- US Government spending is out-of-control. With foreign buyers opting not to buy US Treasuries (which are issued to finance US Government spending) will future bond offerings need to be priced at more attractive rates to entice investors?
The current situation invites comparison with the 1970s…a decade when interest rates rose from 4% to over 18%, shares fell out of favour with the investing public and gold soared in value.
In the mid-1960s (just like the late 1920s) very few entertained the prospect of an abrupt change in a trend they had come to believe was their friend.
Could we be on the brink of another abrupt and disruptive change in a long-term trend?
I think so.
Get ready for upheaval and a more turbulent future.
Until next week.
Regards,
 |
Vern Gowdie,
Editor, The Daily Reckoning Australia
