ASX Live News | XJO Looks to make modest gains; US Stocks up, China data today
Can commodity prices return in the next financial year?
During the first quarter of 2023, global commodity prices experienced a 14% decline, resulting in a roughly 30% reduction from their peak in June 2022 by the end of March.
This decline can be attributed to a combination of decelerating economic activity, favourable winter weather conditions, and a realignment of global commodity trade flows.
According to the World Bank, commodity prices are anticipated to experience a 21 %decrease within the current year, with expectations of relative stability throughout 2024.
This projected decline for 2023 signifies the most substantial drop since the onset of the pandemic.
Energy prices are forecasted to be approximately 23% lower than the previous year’s average in 2022 while maintaining a relatively steady state in 2024.
However, these predictions stand with all things remaining equal. Name a year in which what we expected with markets remains static.
The number of factors that could change this calculus to see rising prices include:
- potential supply disruptions in energy and metals, partially attributable to trade restrictions
- escalating geopolitical tensions
- an unexpectedly robust recovery in China’s industrial sector
- adverse weather events
It is worth keeping an open mind to what could happen if events fall outside standard economists’ expectations and how those may affect prices in the future.
So, eventually, you can catch the upside while others realign their orthodox thinking to the heterodox reality.
If you want to learn more about the factors that shift commodities, click below.
https://commodities.fattail.com.au/what-determines-commodity-prices/2023/06/28/
ASX 200 closes slightly up 0.12%
The ASX 200 closed up 0.12%, recovering after a shaky morning. The afternoon’s recovery was led by Information Tech and Industrial sectors, while Real Estate, Healthcare, and Staples were the worst-performing sectors of the day.
The best individual performers:
- PSC Insurance Group [ASX:PSI], up 5.22%
- Macquarie Technology Group[ASX:MAQ], up 4.38%
- Downer Edi [ASX:DOW], up 3.81%
- The Star Entertainment Group[ASX:SGR], up 2.43%
- De Grey Mining [ASX:DEG], up 2.27%
The worst performers:
- Abacus Property Group [ASX:ABP], down 3.24%
- Centura Industrial [ASX:CIP], down 2.20%
- HUB24 Ltd [ASX:HUB], down 2.00%
- TELIX Pharmaceuticals [ASX:TLX], down 1.92%
- Brickworks Ltd [ASX:BKW], down 1.84%
Chinese PMI data shows recovery stalling
Chinese manufacturing shrinks for the third straight month in June — with the official manufacturing PMI coming in at 49.0
This is the lowest reading since February 2021 and suggests that the recovery in the manufacturing sector is slowing.
Non-manufacturing activity also weakened in June, with the PMI coming in at 53.2.
That is the lowest reading since March 2022 and also shows that the service sector is struggling from the after-effects of the COVID lockdowns, while Bejing continues to hold back its major stimulus.
Some market analysts are holding out hope for an announcement of a stimulus package when the Politburo convene in July.
However, President Xi’s government finds itself limited in terms of effective solutions.
The traditional approach adopted by Beijing, which involves implementing extensive economic stimulus to stimulate demand, has resulted in oversupply in both the real estate and industrial sectors.
Additionally, this strategy has contributed to escalating debt levels among local governments.
Concerns have arisen regarding the possibility of China experiencing a prolonged period of economic stagnation similar to Japan’s experience following three decades of unparalleled growth.
Here is a recent update on projections from Bloomberg.
 Source: Bloomberg
Australian/NZ private sector credit updates for May
Australian private sector credit data was released for May, sticking to forecasted growth of +0.04$ month-over-month growth.
Personal credit growth was stable at 0.2%, while credit eased slightly for both housing (0.3% down from 0.4%) and businesses (0.5% from 1.0%)
Below is the total private-sector credit for Australia.
source: tradingeconomics.com
Meanwhile, over the ditch, New Zealand currently has an OCR of 5.50%. Many believe this will be the top rate for the Reserve Bank this year that will be held in order to reign in inflation.
New mortgage borrowing in April 2023 was down 28% year-on-year, driven largely by record-low property listings in a downturned market.
Non-mortgage lending was up marginally 4.1% year-on-year, but overall household borrowing was down 26% year-on-year. Here’s a snapshot of NZ household borrowing.
 Source: Centrix
One troubling sign from the New Zealand economy, which officially slipped into recession earlier this month, was the rise in company defaults and liquidations seen from this early year data; according to the latest stats from Centrix, this trend has continued.

Source: Centrix
Australian retailers show resilience
Australian retailers’ May results are out, showing unexpected strength despite drops in consumer confidence.
Much of this could be from End-of-FY discounting but indicates households are still willing to spend.
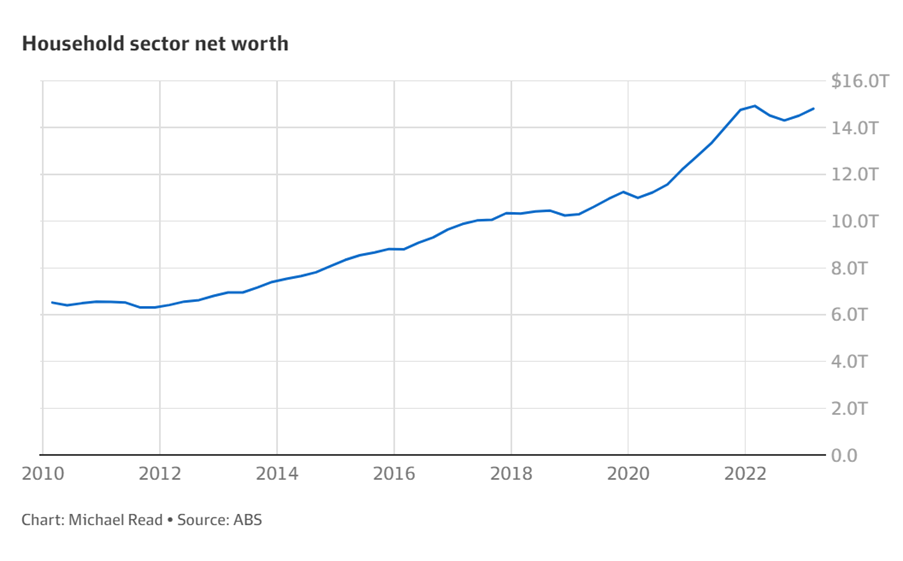
Households have regained almost all of the losses from the interest rate hikes on the back of rising property prices and the sharemarket. Household net worth in Australia grew by $298 billion in the first quarter of 2023, according to the Australian Bureau of Statistics, bringing the sector’s net worth to $14.8 trillion.
Jarden chief economist Carlos Cacho warned that household wealth would be working against the RBA’s attempts to bring down inflation, as households continued to spend.
‘While the RBA has never had a lot of faith in the wealth effect, their own research suggests each 1 per cent change in wealth is associated with a 0.1 per cent change in household consumption,’ Mr Cacho said.
‘Taken together with other data over the last month we think that more hikes are clearly needed to ensure a return of inflation to the RBA’s 2-3 target band in a reasonable time frame.’
Aust May retail sales +0.7%/4.2%yoy, stronger than exp & may have been boosted by earlier than normal end of fin yr discounting.Retail sales have stalled since Nov & r falling in real terms but their relative resilience may embolden the RBA in terms of more rate hikes
ABS charts pic.twitter.com/Rif7YwCREk— Shane Oliver (@ShaneOliverAMP) June 29, 2023
ASX 200 opens slightly down
ASX 200 opened slightly down today, with concerns in the market outlook slightly boosted by positive news from the US, where Banks completed their annual stress test without issue, sending bank stocks up.
The test conducted overnight showed that the 23 largest US banks were able to remain above their minimum capital requirements in a hypothetical ‘crash scenario’ with projected losses of $541 billion.
Chinese manufacturing data is out late this morning, and NZ private sector credit score out at 11:30am.
The start of the second half of the financial year will see some changes as of July 1st:
- Increase in Australia’s minimum wage to $23.23 per hour
- New parents will be able to claim an extra 20 weeks of paid parental leave
- Age pension will increase to 67
- Expansion of the first homeowner’s scheme eligibility to friends, siblings and other family members to jointly apply
All figures shown are from 10:00am AEST
- $AUD up +0.08% at 66.81 US cents
- ASX futures up +0.19% to 7,166.5
- S&P 500 up +0.45%
- NASDAQ down -0.0031%
- DOW up +0.80%
- FTSE down -0.38%
- STOXX up +0.096%
- SSE up +0.72%
- Bitcoin up +0.95% to $US 30,432.77
- Spot gold up +0.05% to $US 1,914.74
- Iron ore up +0.04% to $US 112.64
- Brent Crude up +0.38% to $US 74.31pb
Good morning all!
Good morning investors!
Kiryll here, taking you through the final day of 1HFY23.
Here’s today’s AI image of everyone celebrating the end of the first half.


Footer
Fat Tail Daily is brought to you by the team at Fat Tail Investment Research
Copyright © 2026 Fat Tail Daily | ACN: 117 765 009 / ABN: 33 117 765 009 / ASFL: 323 988